
Figure 2. Analysis of CAR T-cell clonal expansion in a CLL patient who had a delayed therapeutic response.
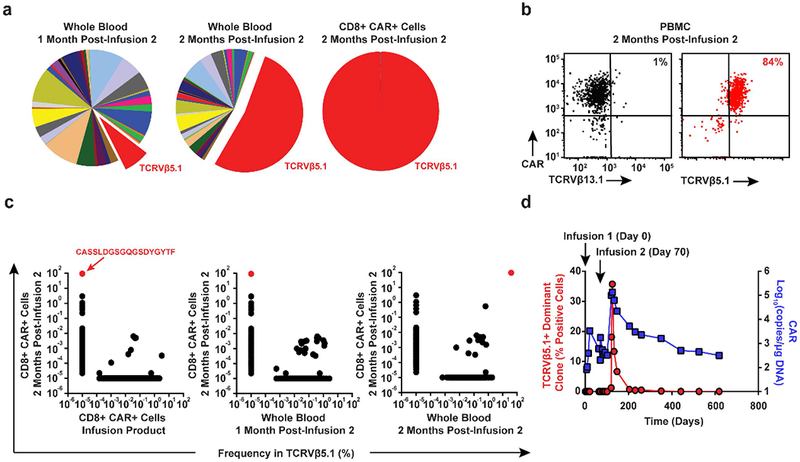
a, Frequency of TCRVβ gene segment usage in the blood of Patient-10 1-month (left pie chart) and 2-months (middle pie chart) following the second CAR T-cell infusion. TCRVβ clonotype frequencies in sorted CAR T-cells at the peak of expansion following are also shown (rightmost pie chart). b, Flow cytometric proportions of TCRVβ5.1 versus TCRVβ13.1 (negative control) positive CAR T-cells. c, Abundance of different TCRVβ5.1 clones in CAR+ T-cells at the peak of activity relative to other time points. Red dots indicate the dominant TCRVβ5.1 clone (representative of 2 independent experiments). d, Expansion kinetics of the TCRVβ5.1+ dominant clone following a second infusion of CAR T-cells plotted in parallel with CTL019 levels. Percentages of positive cells were calculated based on the results of a qPCR assay designed to amplify clonotype-specific sequences.