
Figure 4. Effect of TET2 alteration on the epigenetic landscape of CAR T-cells.
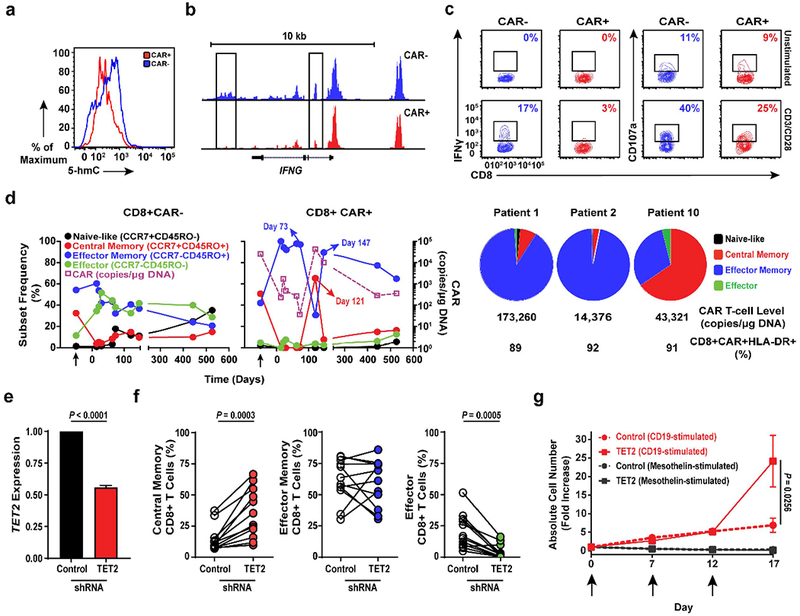
a, Total 5-hmC levels in CAR+ and CAR− T-cells cultured from Patient-10. Histograms depict the intensity of intracellular 5-hmC staining. b, Genome browser views of ATAC enrichment at the IFNG locus of Patient-10 T-cells. c, Frequencies of IFNγ and CD107a expressing T-cells expanded from Patient-10 unstimulated or stimulated with anti-CD3/CD28 antibodies. Insets indicate frequencies of gated cell populations. d, Longitudinal differentiation phenotypes of CAR+ (left) and CAR− (middle) T-cells from Patient-10. Arrows denote pre-infusion CAR T-cells. Differentiation phenotype at the peak of in vivo activity is shown in two long-term complete responding CLL patients (Patients-1 and -2) compared to Patient-10 (right). Pie slices represent T-cell subset frequencies. The CTL019 cell level and frequencies of activated CAR T-cells expressing HLA-DR at the peak of each patient’s response are listed below the pie charts. e, TET2 expression in healthy donor CD8+ T-cells transduced with a scrambled shRNA (control) or TET2 sequences. Error bars depict s.e.m. f, Frequencies of central memory (left), effector memory (middle) and effector CD8+ T cells following shRNA-mediated knock-down of TET2 (n = 12; pooled results from 4 independent experiments). g, Proliferation of healthy donor CTL019 cells (n = 8; 3 independent experiments) in response to repetitive stimulation (arrows) with K562 cells expressing CD19 or mesothelin (negative control). CAR T-cells were transduced to express either a scrambled control or TET2-specific shRNA. P values were determined using a two-tailed, paired student’s t-test. All error bars depict the s.e.m.