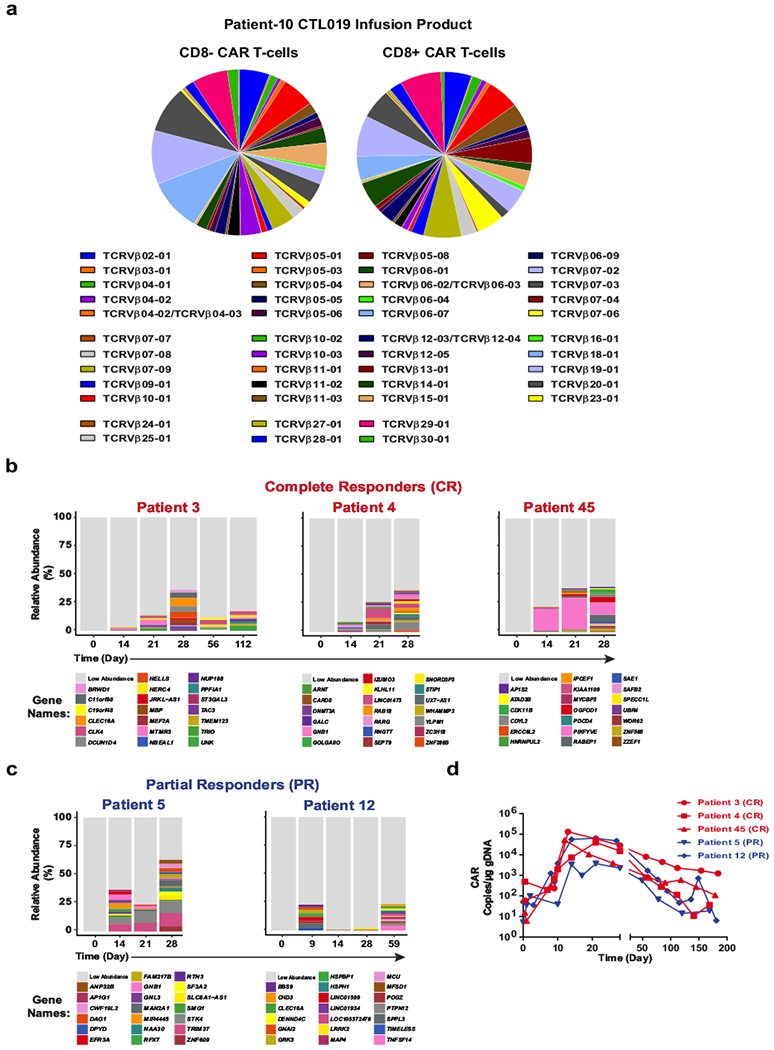
Extended Data Fig. 3 |. Clonal composition of CAR T cells from Patient-10 and other subjects treated with CTL019.

a, TCRVβ distribution in CD8− (left) and CD8+ (right) CAR T cells in the cellular infusion product of Patient-10. b, Relative frequencies of CAR T cell clones in three patients who had complete responses to CTL019 therapy, summarized as stacked bar graphs. Each colour (horizontal bar) denotes a major cell clone, as marked by lentiviral integration sites. c, Integration site analysis in CAR T cells from two partially responding patients. d, In vivo expansion of CAR T cells in the above patients as determined by quantifying the average CAR transgene copies per microgram DNA at each time point.
