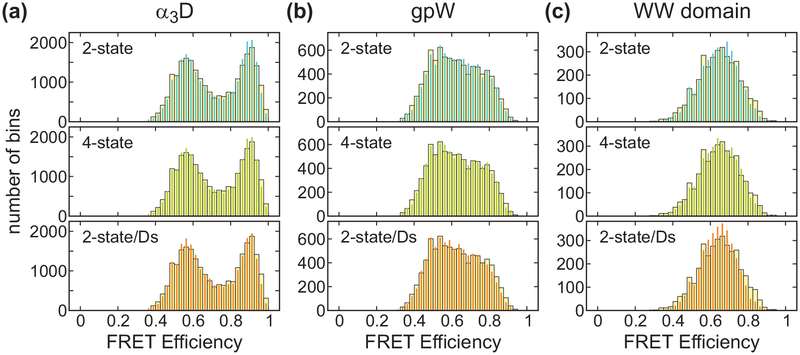
Figure 7.
Experimental (wide bars) and recolored (narrow bars) FRET efficiency histograms of three proteins near the mid-point of denaturation: 2.3 M GdmCl (α3D), 2.5 M GdmCl (gpW), and 2 M GdmCl (WW domain). The photons were recolored using the maximum likelihood parameters obtained from the 2-state (blue), 4-state (green), and 2-state/Ds (orange) analyses. Trajectories with a mean photon count rate of > 30 ms−1 were included in the analysis.

