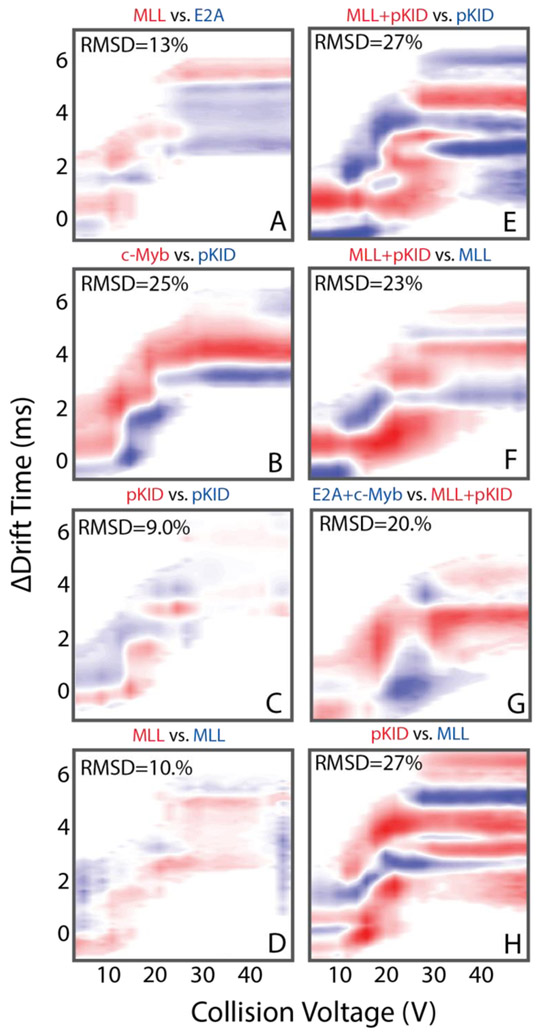
Figure 3.
RMSD values and CIU difference plots, computed using CIUSuite, for binary comparison across the data shown in Figure 2. Each difference map indicates where the intensity values for the two subtracted CIU fingerprints are greatest with a blue/red color code, indicated above each panel. The comparisons made are between: (A) MLL and E2A KIX:peptide complexes, (B) pKID and c-Myb KIX:peptide complexes, (C) replicate KIX:pKID CIU fingerprints, (D) replicate KIX:MLL CIU fingerprints, (E) the ternary KIX:MLL:pKID complex and the KIX:pKID complex, (F) the ternary KIX:MLL:pKID complex and KIX:MLL the complex, the (G) the KIX:E2A:c-Myb and KIX:MLL:pKID complexes, and (H) the KIX:pKID and KIX:MLL complexes.

