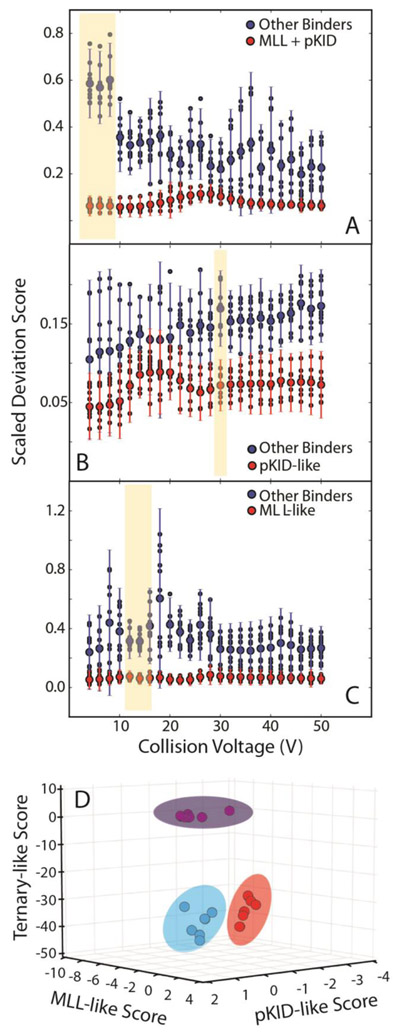
Figure 5.
A plot of SDS vs collision voltage for peptides compared to an (A) ternary complex average, (B) a pKID-like average, or a (C) MLL-like average. The blue circles represent the average values computed for all other peptides, and the red circles represent the average values computed for the complex targeted for the analysis. Color coded error bars indicate standard deviation values for the analysis produced across replicate CIU experiments (n =3). (D) Z-scores for each KIX:peptide complex plotted against an MLL-like average, pKID-like average, and ternary complex average. Data for the pKID-like complexes are represented by blue circles, the MLL-like complexes by red circles, and the ternary complexes by green circles. The ellipses around the points are added to guide the eye and illustrate the clustering of the different complex classes.

