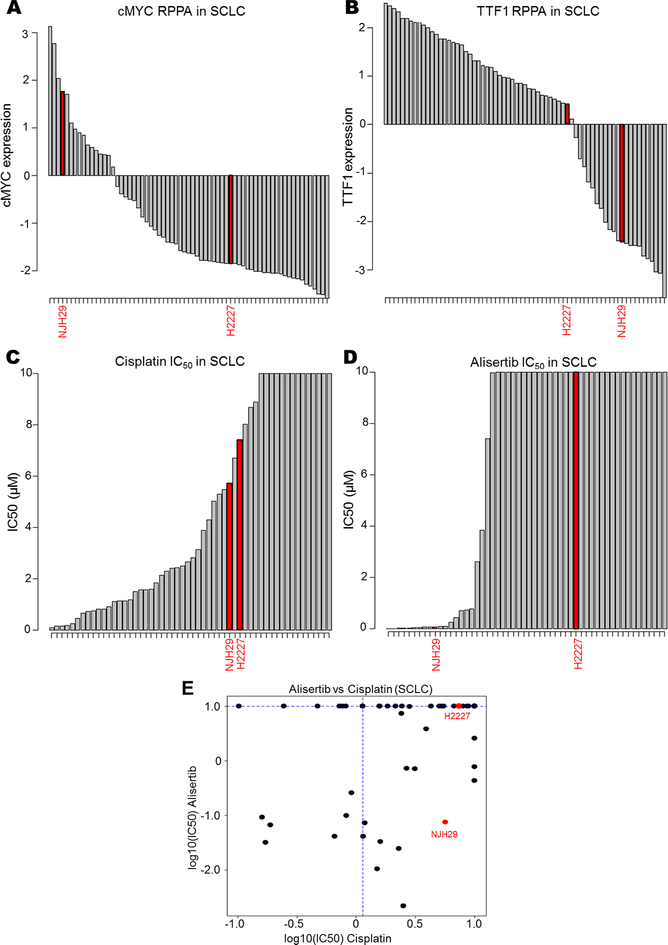
Figure 5. DISARM accurately predicts biomarkers for AURKA sensitivity.
(A,B) Bar graphs depicting RPPA-based expression of cMYC and TTF1 for NJH29 and H2227 relative to other SCLC cell lines. Bar graphs illustrating experimentally observed IC50 values for NJH29 and H2227 for cisplatin (C) and alisertib (D) relative to other SCLC cell lines along with classification according to DISARM 2×2 plot (E).

