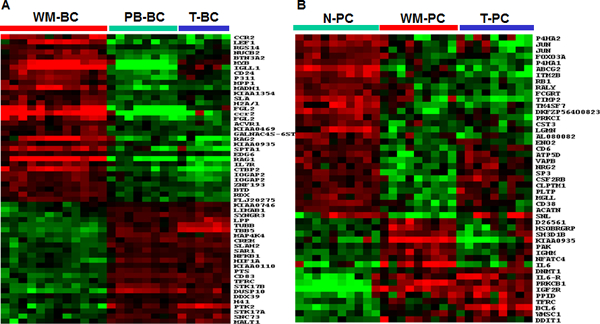
Fig. 3. Delineation of the top significantly expressed genes distinguishing WM cases from the controls.

A, Expression of the 55 top significantly expressed genes in WM-BC samples. The WM-BC-defined clusters for tumor B-cells (horizontal red bar), PB-BC (horizontal green bar), and T-BC (horizontal blue bar) are indicated. B, Expression of the 46 significantly expressed genes in WM-PC. The WM-PC-defined clusters for tumor plasma cells (horizontal red bar), N-PC (horizontal green bar), and T-PC (horizontal blue bar) are indicated. The clustering analysis illustrates that the expression pattern of WM-PC is more similar to that of T-PC than N-PC.
