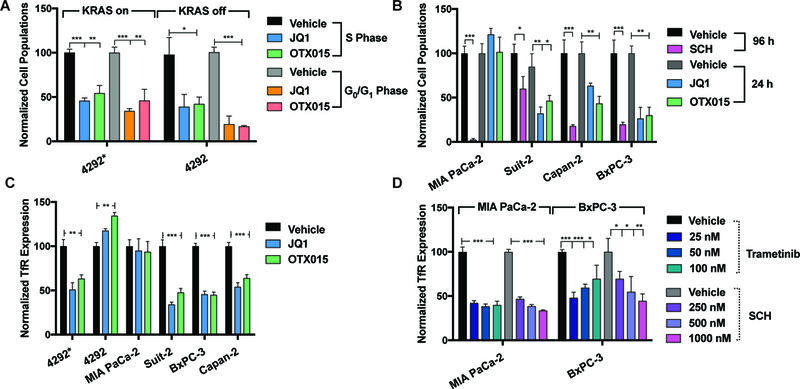
FIGURE 1:

Cell cycle and protein analysis of drug treatment with BRD4, ERK, and MEK inhibitors in human PDAC and doxycycline-inducible KRAS mutant murine PDAC cells. (A) % of cells in S-phase and G0/G1 24 h post-treatment with BRD4 inhibitors in doxycycline-inducible KRAS mutant murine cells. 4292* indicates iKras*p53* mutant upon doxycycline induction, and 4292 indicates cells that are not doxycycline supplemented or KRAS mutant. (B) % of cells in S-phase post-treatment with BRD4 inhibitors and ERK inhibitor (1 μM of drug administered) in human PDAC cell lines. Timeline of analysis is indicated in the figure legend. (C) A drug-dependent decrease of surface TfR protein expression upon BRD4 inhibition in murine and human PDAC cells 48 h post-treatment. (D) A drug-dependent decrease of surface TfR protein expression in MIA PaCa-2 and BxPC-3 cells upon ERK inhibition with SCH772984 and MEK inhibition with trametinib. For statistical analysis: *P < 0.05, **P < 0.01, ***P < 0.001.
