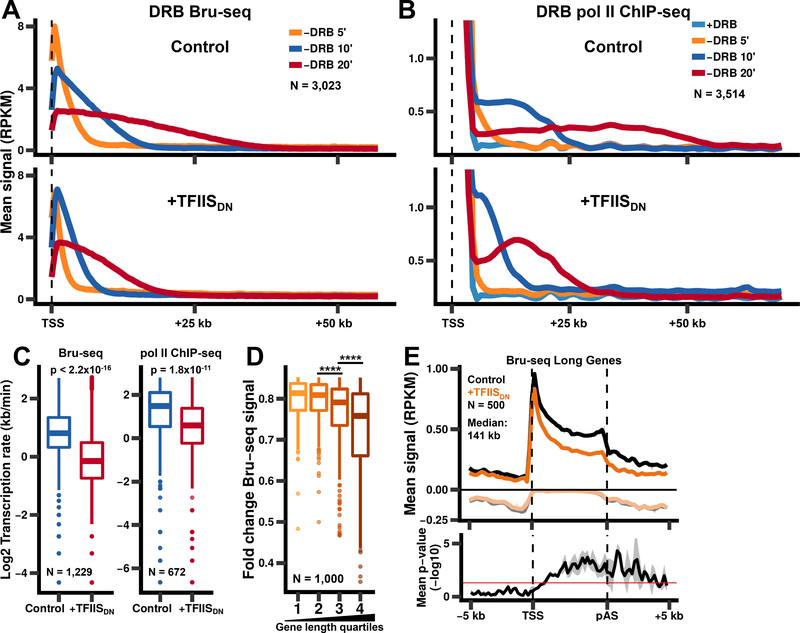
Figure 3. Pol II cleavage activity is required for rapid elongation through the gene body.
(A) Inhibition of pol II cleavage activity reduces the rate of transcription elongation. Metaplots of Bru-seq signals (500 bp bins) after washout of DRB for non-overlapping genes >75 kb long.
(B) Metaplots of pol II ChIP-seq signals after washout of DRB as in A.
(C)Transcription rates were calculated using Bru-seq data shown in A (left) or pol II ChIP-seq data shown in B (right) by comparing the 10 min and 20 min timepoints for genes where waves were detected for both timepoints. p-values were calculated using the Welch two sample t-test.
(D)Transcription of long genes is more sensitive to inhibition of pol II RNA cleavage activity. The fold change in Bru-seq signal was plotted for the top 1,000 genes that show reduced Bru-seq signal after expression of TFIISDN, divided into quartiles based on gene length. Fold changes were calculated from two biological replicates for genes >1 kb long and separated by >2 kb. pvalues were calculated using the Welch two sample t-test with Bonferroni-Holm correction. **** p < 0.0001.
(E)Metaplots of Bru-seq signals for genes from the 3rd and 4th quartiles from E (N = 500, median length: 141 kb). The mean signal and SEM was plotted as in Fig. 2A for two biological replicates. Negative values correspond to anti-sense signal. p-values (bottom panel) were calculated by comparing the sense Bru-seq signals for uninduced and TFIISDN-expressing cells for each replicate using the Welch two sample t-test. p-values were then averaged across the two biological replicates with the shaded region representing the SEM.

