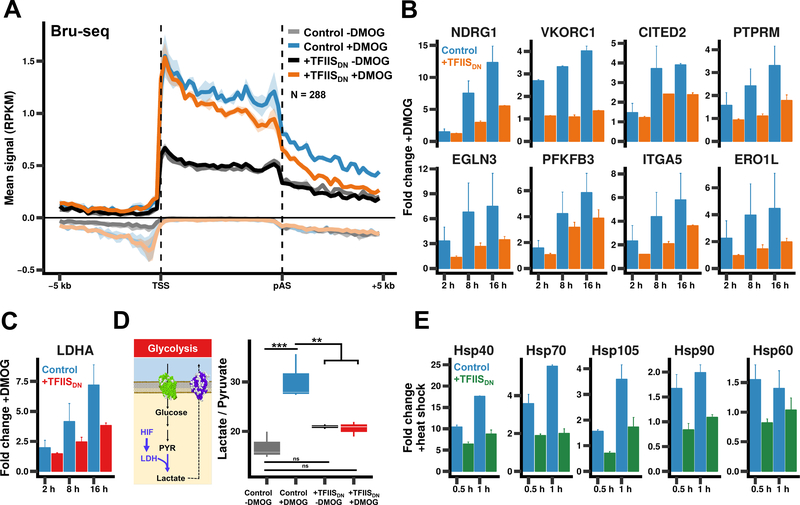
Figure 6. Pol II cleavage activity is required to rapidly activate gene expression.
(A) TFIISDN impairs transcriptional activation of hypoxia inducible genes in response to DMOG. Metaplots of pulse-labelled nascent RNA-seq (Bru-seq) signals for cells treated +/−2 mM DMOG for 16 hours. Data were plotted for genes with increased signal +DMOG (p-value < 0.01). The mean signal and SEM was plotted for two biological replicates as in Fig. 2A. Negative values correspond to anti-sense signal.
(B) qRT-PCR showing the fold change in mRNA abundance for hypoxia-responsive transcripts in cells treated with 2 mM DMOG for indicated times. Error bars represent the SEM for at least two biological replicates.
(C) Lactate/pyruvate ratios were determined by UHPLC-MS in uninduced and TFIISDNexpressing cells +/−2 mM DMOG for 16 hrs. ** p < 0.01, *** p < 0.001 ANOVA.
(D) qRT-PCR showing the fold change in LDHA mRNA as in B.
(E) qRT-PCR showing the fold change in heat shock mRNA after incubation at 42° as in B.

