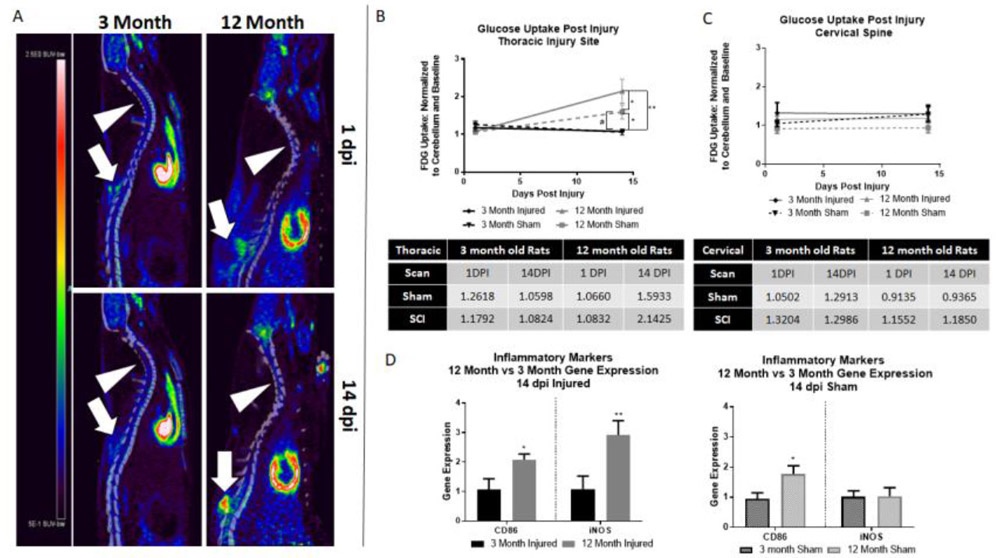
Figure 2.

12 month rats show increased glucose uptake after SCI compared to 3 month rats. A) Representative images of both 3 and 12 month rats at 1 and 14 dpi. Arrowheads point to cervical spine, block arrows point to thoracic injury. Heatmap provided to left of images – red represents highest level of uptake. B) 12 month injured rats showed significantly higher glucose uptake than all other groups. 12 month sham rats also show significant increases in glucose uptake compared to 3 month injured (*) and sham (#) groups. Quantitative glucose uptake values in provided table (standard uptake value normalized to cerebellum control and baseline). C) At the cervical spine, no significant difference is found in any group by age or injury. D) When compared to 3 month rats, 12 month injured rats show significantly increased gene expression of both CD86 and iNOS at 14 dpi. 12 month sham rats showed significantly higher CD86 gene expression than 3 month sham rats; no significant difference was seen in iNOS by age group. N=4-6/group; *p<0.05, **p<0.005.
