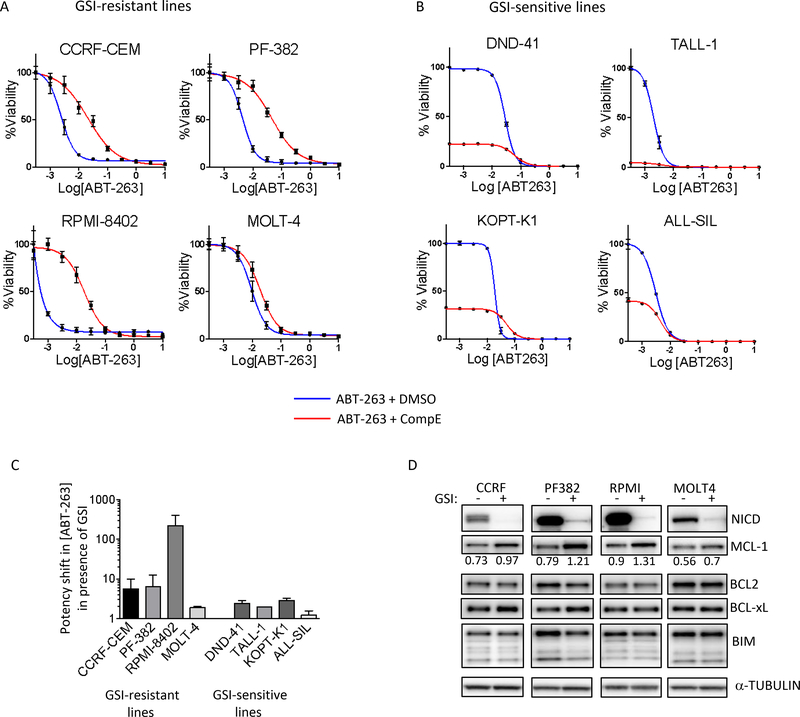
Figure 3. NOTCH inhibition desensitizes human T-ALL cell lines to ABT-263.
GSI-resistant (A) and GSI-sensitive (B) human T-ALL cell lines were pre-treated with DMSO or 1 μM CompE for 72h, followed by treatment with varying concentrations of ABT-263, in the continued presence of DMSO or 1 μM CompE for another 72h. At the end of the six-day period, cell viability was measured with CellTiter-Glo and expressed as a percentage of drug-treated cells to DMSO-treated cells. The experiments were done twice, in triplicate each and the values shown are mean ± SD. (C) Bar graph shows the shift in the potency of ABT-263 upon GSI treatment. Values are calculated using 50% viability loss over DMSO and GSI alone, for single agent and GSI combination (GSI alone = 100%) respectively. (D) GSI-resistant T-ALL lines were treated with DMSO or 1 μM CompE for 5 days, harvested, lysed and subjected to western blot analysis using the indicated antibodies. Independent experiments were done three times and a representative result is shown. MCL-1 levels, quantitated using GeneTools from SynGene, normalized to α-tubulin, are shown under MCL-1 blot.

