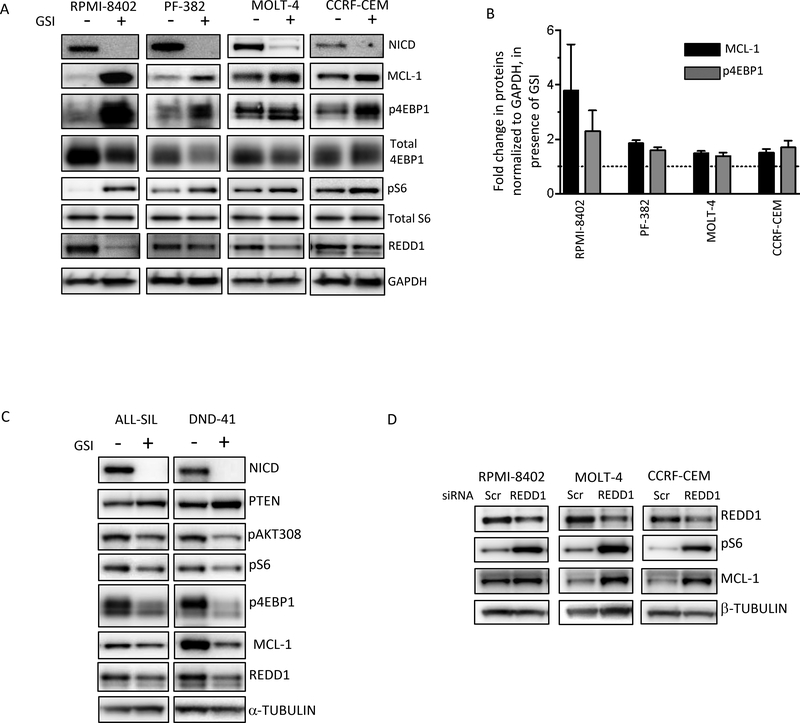
Figure 4. NOTCH1 represses mTORC1 activity and MCL-1 levels in GSI-resistant cell lines.
(A) GSI-resistant lines were treated with DMSO or 1 μM CompE for 5 days, harvested, lysed and subjected to western blot analysis using the indicated antibodies. Independent experiments were done three times and a representative result is shown. (B) Changes in levels of MCL-1 and p4EBP1 upon GSI treatment, normalized to GAPDH, were quantitated using GeneTools from SynGene, and presented on a graph. The experiments were done at least 3 times and values shown are mean ± SD (C) GSI-sensitive cell lines were mock-treated or treated with 1 μM CompE for 5 days, harvested, lysed and subjected to Western blot analysis using the indicated antibodies. (D) GSI-resistant lines were transfected with Scramble siRNAs or siRNAs against REDD1 (DDIT4). After 72 hrs cells were harvested, lysed and subjected to western blot analysis using the indicated antibodies.

