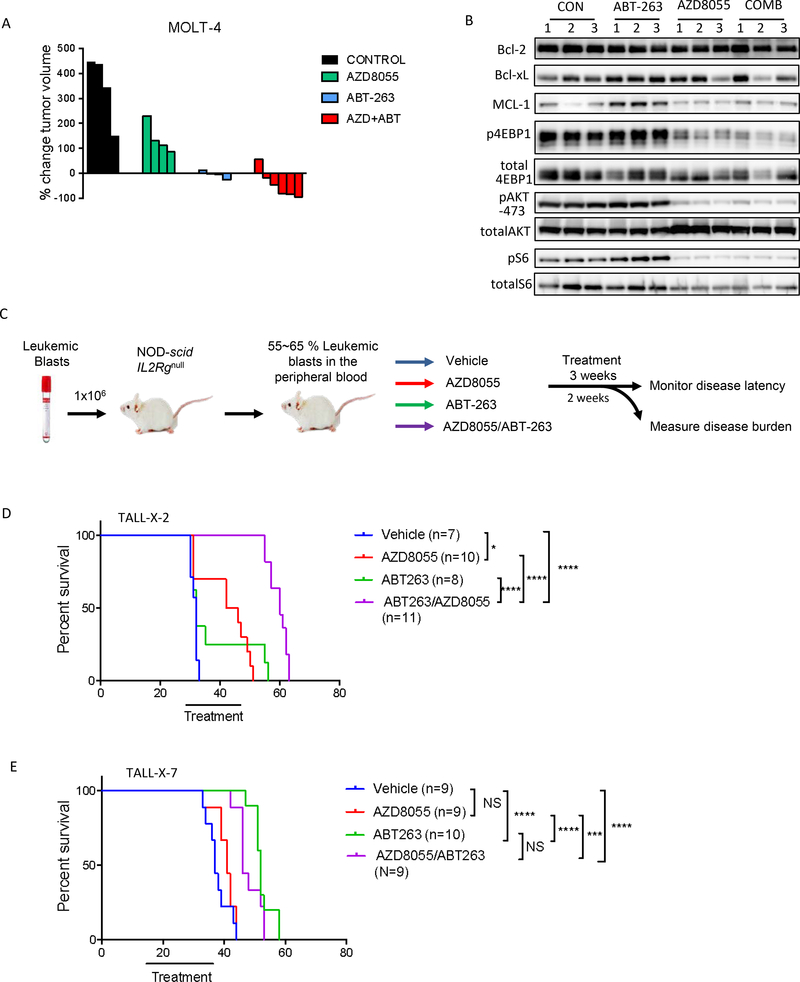
Fig 6. The combination of AZD8055 and ABT-263 causes tumor regression in vivo:
(A) GSI-resistant MOLT-4 cells were grown as xenograft tumors in Nu/Nu mice. Mice were randomized into 4 treatment cohorts: control (no drug), 16 mg/kg AZD8055, 80 mg/kg ABT-263, or their combination. Waterfall plot showing percentage change in tumor volume (relative to initial volume) for individual tumors in tumor-bearing mice, treated for 21 days. (B) For pharmaco-dynamic studies, tumor-bearing mice were treated as in (A), for 3 days. On the third day, tumors were harvested 2h after drug treatment and snap frozen. Proteins were extracted, 15 μg protein from each sample was run on an SDS-PAGE and subjected to western blotting with the indicated antibodies. (C) Schematic of the in vivo experiment with primary T-ALL cells. Briefly, NOD-scid IL2rg−/− (NSG) mice were intravenously injected with primary human T-ALL blasts. When human leukemic blasts reached 55–65% mouse peripheral blood, mice were randomized to one of four treatment groups indicated. 2–6 mice from each group were sacrificed after 2 weeks of treatment to assess leukemic burden (data shown in Fig S10, S11). The remaining mice were treated for a total of 3 weeks, after which survival was monitored. (D, E) Kaplan-Meier survival curves are shown for mice engrafted with TALL-X-2 (D) or TALL-X-7 (E) patient samples. The difference in overall survival between the treatment groups was assessed by log-rank test (*p<0.05, ***p<0.001, ****p<0.0001).

