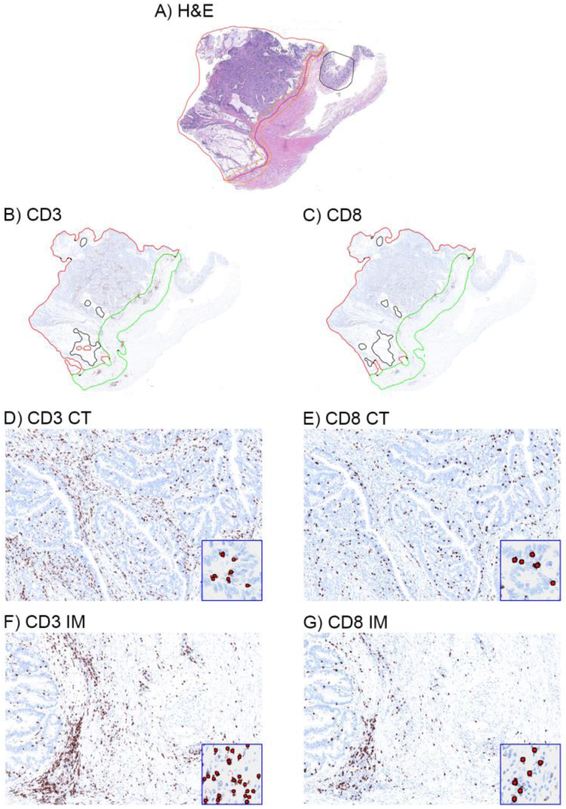
Figure 1. Representative immunohistochemical images of CD3+ and CD8+ T cells in the tumor microenvironment of colon cancers.
H&E-stained whole-tissue sections were manually annotated to outline the entire tumor region (red line) and demarcate the invasive margin (orange line) (a). Annotations were transferred onto adjacent CD3 and CD8 IHC images (b-c) with an algorithm outlining the invasive margin (IM, green line) and core of the tumor (CT, red line) (see Methods). Whole tissue sections (a-c) and magnified regions (40x, d-g) are shown. Insets show algorithmic cell-by-cell classification of CD3 and CD8 T cells (red dots). T-cell densities were quantified (score 0–100) within the entire tumor compartment.

