Figure 1:

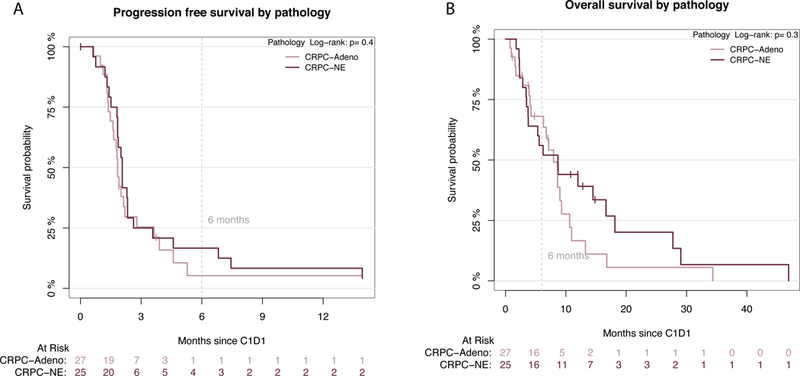
(A) Progression free survival and (B) Overall survival Kaplan Meir Curves based on pathology subtype by central pathology review (CRPC-Adeno= red; NEPC= blue). PFS and OS for the entire cohort is shown in Supplementary Figure 5.

(A) Progression free survival and (B) Overall survival Kaplan Meir Curves based on pathology subtype by central pathology review (CRPC-Adeno= red; NEPC= blue). PFS and OS for the entire cohort is shown in Supplementary Figure 5.