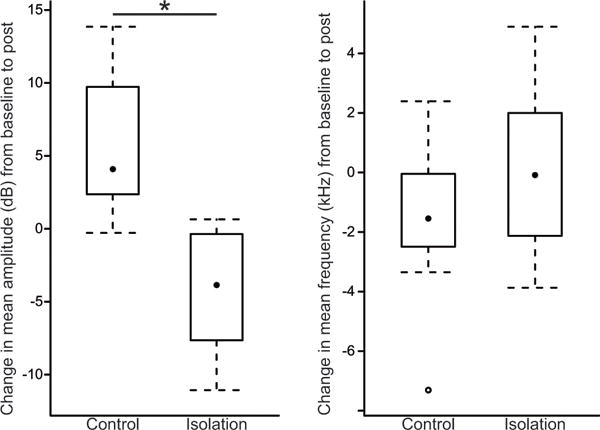
Fig. 2.

Box and whisker plots showing the change in USV acoustic parameters (amplitude and frequency) from baseline to after 8 weeks of either standard paired housing (Control) or social isolation (Isolation). The median is indicated with a black dot, the inter-quartile range is contained within the box, and the whiskers extend to the last observation within 1.5 times the inter-quartile range. The single outlier is indicated by an open circle. On the y-axis 0 (dB or kHz) means no change from baseline to post-experiment, a positive value indicates an increase from baseline to post-experiment, and a negative value means the measurement decreased from baseline to post-experiment. Change in amplitude was significantly lower in the social isolation group compared to the socially-housed control group (* indicates p < .05).
