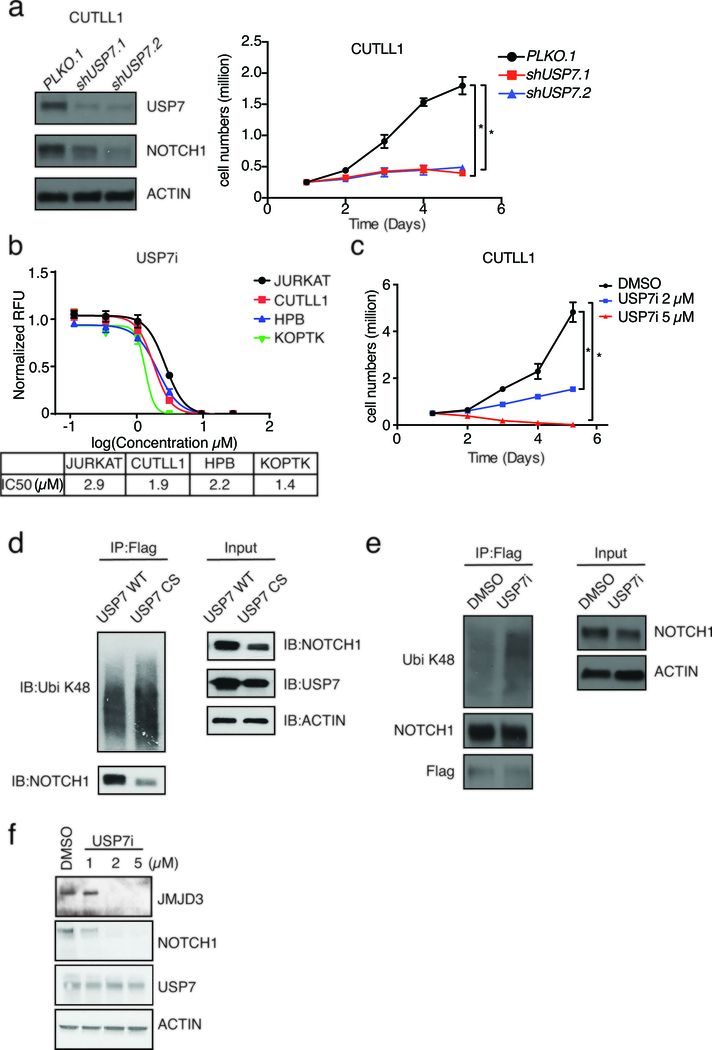
Figure 3. USP7 plays a critical role in T-ALL maintenance via regulation of NOTCH1 protein levels.
a, CUTLL1 T-ALL cells were transduced with a control retroviral vector and two different shUSP7 (shUSP7.1 and shUSP7.2). Left panel: protein levels of USP7 and NOTCH1 in CUTLL1 T-ALL cells (control, shUSP7.1 and shUSP7.2). Right panel: Growth study was performed after knocking down of USP7 in CUTLL1 cells. Data are shown as mean ± SD derived from 3 independent biological replicates, * P≤0.05. b, IC50 curve of USP7i in several T-ALL cell lines (JURKAT, CUTLL1, HPB and KOPTK). c, Growth curve of CUTLL1 T-ALL cells upon daily treatment with increasing concentrations of USP7i. Data are shown as mean ± SD derived from 3 independent experiments, * P≤0.05. d, Representative western blot studies following immunoprecipitation of Flag-NOTCH1 in 293T cells at denaturing condition. 293T cells were transfected with Flag-NOTCH1, ubiquitin and FBXW7 associated with USP7 WT or USP7 CS as indicated. e, A representative western blot following immunoprecipitation of Flag-NOTCH1, conducted in three biological replicates, is shown. Flag-NOTCH1 overexpressed CUTLL1 T-ALL cells were treated with DMSO (control) or USP7i (5μM) for 8h, whole cell extracts were isolated under denaturing conditions to disrupt protein-protein interactions, followed by Flag-NOTCH1 immunoprecipitation. f, Western blot analysis of JMJD3, NOTCH1, and USP7 protein levels upon treatment of CUTLL1 T-ALL cells with increasing concentrations of USP7i for 24h. For all immune-blots presented, one of three representative biological replicates is shown.

