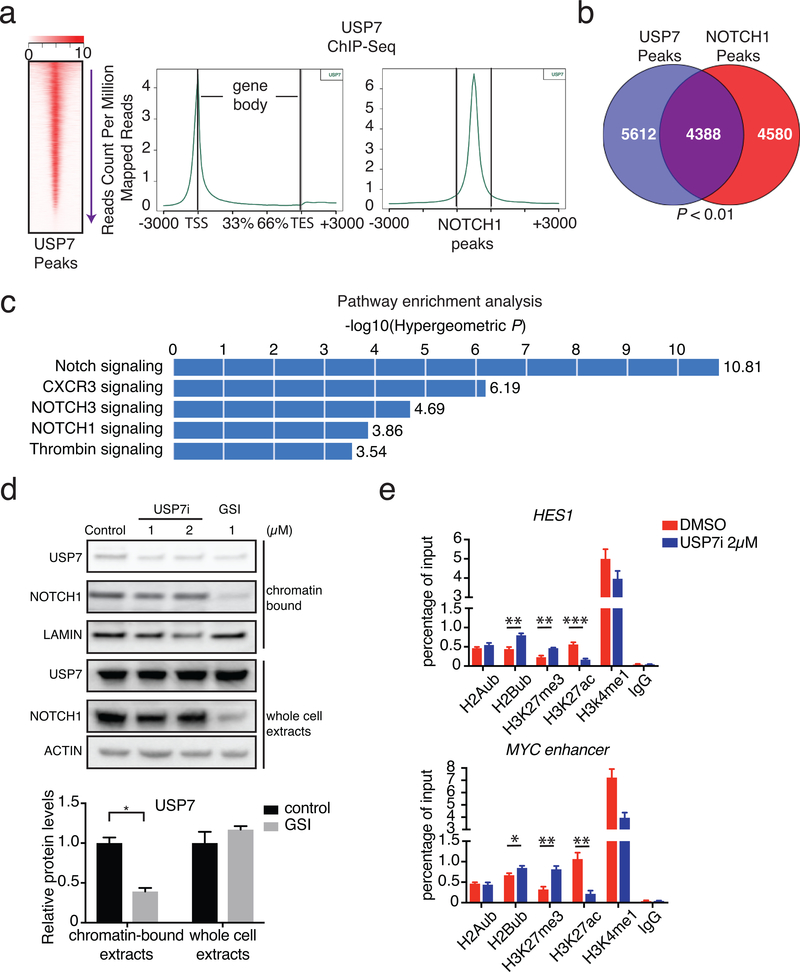
Figure 4. USP7 and NOTCH1 co-bind oncogenic targets.
a, Heatmap of USP7 peak intensity (left) and metaplots showing the average counts per million of USP7 ChIP-Seq signal across all genes (middle), and NOTCH1 peaks (right). One of three representative biological replicates is shown. b, Analysis of ChIP-Seq data showing the overlap of USP7 peaks with NOTCH1 peaks. c, GREAT (Genomic Regions Enrichment of Annotations Tool) analysis showing enrichment for specific gene functions amongst the USP7-bound peaks used in panel b. d, Upper panel: representative protein levels of USP7 and NOTCH1 in the chromatin-bound fraction and whole cell extracts of JURKAT T-ALL cells upon treatment with DMSO (control), USP7i, or GSI. One of three biological replicates is shown. Lower panel: quantification of USP7 protein levels in upper panel. e, CUTLL1 T-ALL cells were treated with DMSO or USP7i 2μM for 2 days. Chromatin immunoprecipitation (ChIP) of indicative histone marker coupled to detection by quantitative real-time PCR at indicative loci were presented. Data are shown as mean ± SD derived from 3 independent experiments, * P≤0.05, * * P≤0.01, * * * P≤0.001.

