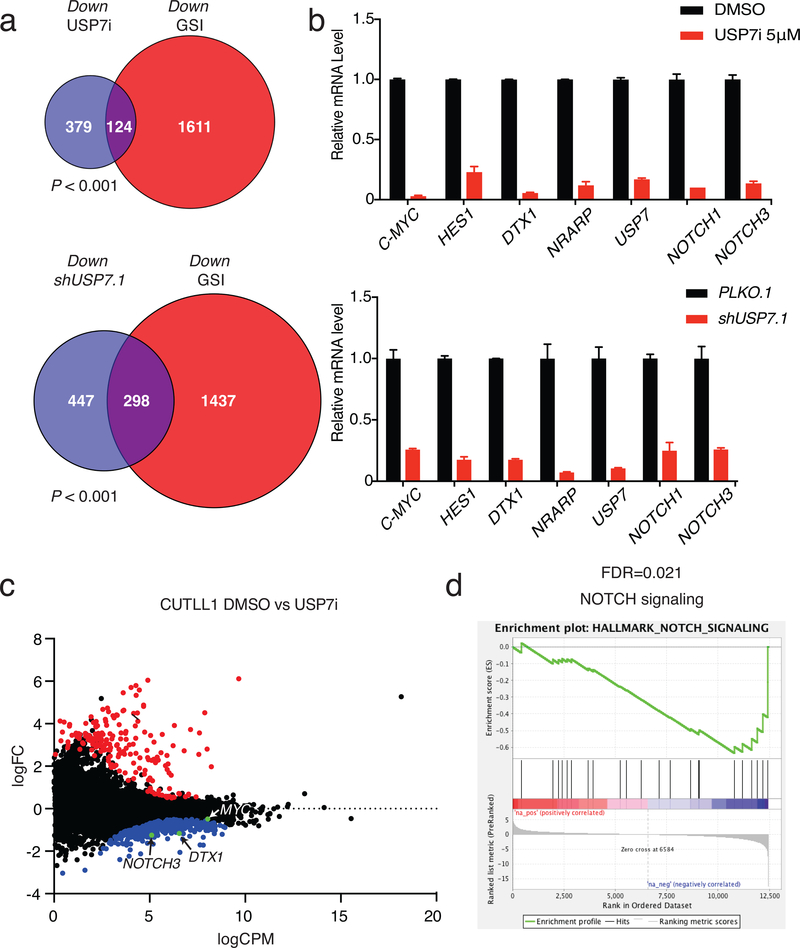
Figure 5. USP7 and NOTCH1 control the expression of oncogenic targets.
a, Analysis of RNA-Seq data showing the overlap of downregulated genes upon USP7 inhibition (1μM) and GSI (1μM) treatment in CUTLL1 T-ALL cells (upper panel). Analysis of RNA-Seq data showing the overlap of downregulated genes upon GSI (1μM) and knockdown of USP7 in CUTLL1 T-ALL cells (lower panel). RNA-Seq data are the average of three biological replicates. b, Upper panel: CUTLL1 T-ALL cells were treated with DMSO or 5μM of USP7i for 3 days. NOTCH1 targets were determined by RT-PCR at mRNA level. Lower panel: RT-PCR of NOTCH1 targets upon treatment of CUTLL1 T-ALL cells with shUSP7.1 and a control retroviral vector. Data are shown as mean ± SD derived from 3 independent experiments. c, Gene expression data from CUTLL1 RNA-Seq showing up- and downregulated genes (red and blue dots, respectively) upon USP7i treatment, as well as genes with no statistically significant expression changes (black dots, P<0.05). NOTCH1 target genes are indicated in the plot. One of three representative biological replicates is shown. d, Gene set enrichment analysis for downregulated genes upon USP7 inhibition. Shown is the NOTCH1 signaling pathway that is significantly downregulated in USP7i versus control cells (FDR=0.021).

