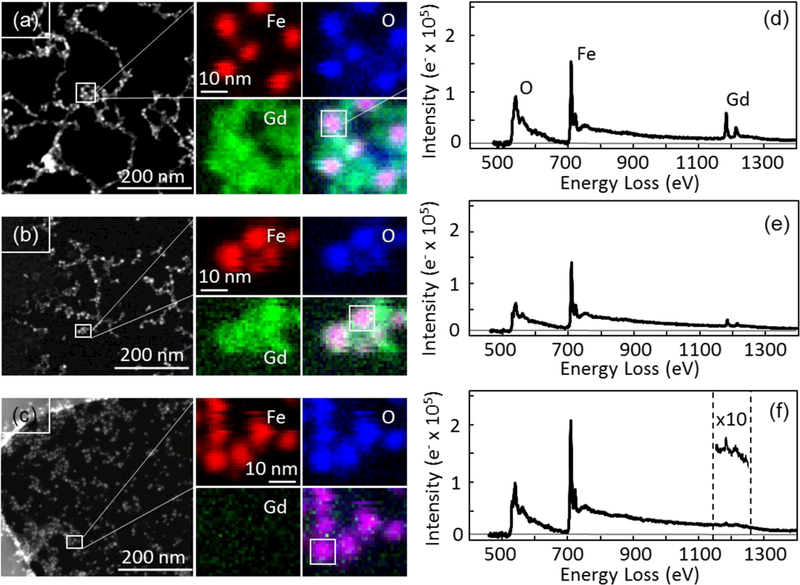
Figure 2.

Characterization of scanning transmission electron microscope (STEM), electron energy loss spectroscopic imaging (EELSI) (a-c), and EELS spectra (d-f) for the FeGd-HN1 (a, d), FeGd-HN3 (b, e), and FeGd-HN6 (c, f) nanoparticles. STEM image (left panel) is shown with small outlined region (white box), from which EELSI data were acquired. Fe (red), O (blue), and Gd (green) maps were generated for each particle by integrating 10–20 eV windows above each core edge: Fe L2,3 edge at 710 eV, O K edge at 530 eV, and Gd M4,5 edge at 1185 eV. Overlay images showing all three colors reveal that Gd oxide surrounds the iron oxide cores with a concentration that is greatest for FeGd-HN1 and least for FeGd-HN6. EELS spectra integrated over 10 nm × 10 nm areas containing the particle (white squares in overlay images) also show a decrease in Gd concentration from FeGd-HN1 to FeGd-HN3. For FeGd-HN6, the Gd signal is only evident after multiplying the intensity scale 10 times (inset).
