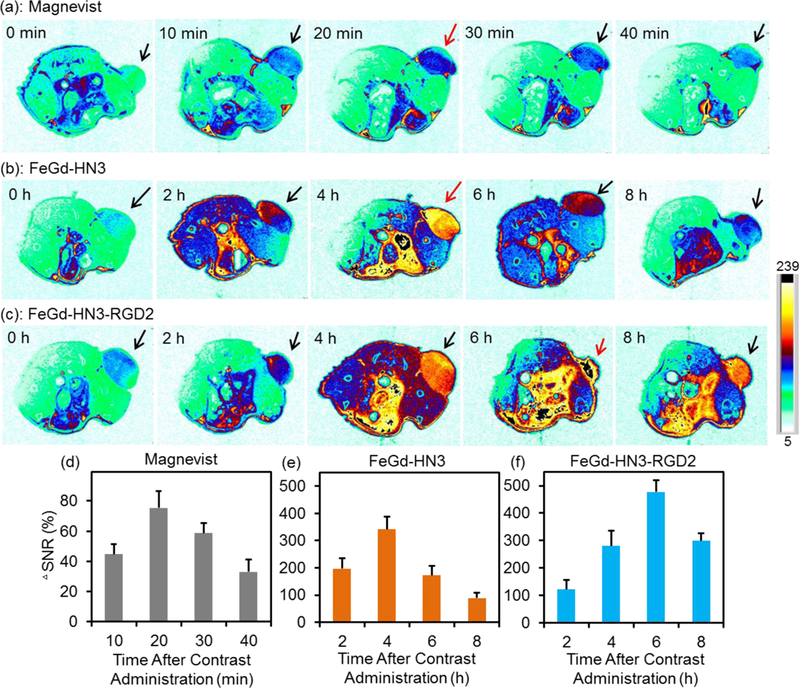
Figure 5.

In vivo T1-weighted MR images of U-87 MG tumor-bearing nude mice (slice orientation: axial) (a-c) and quantification of the tumors (d-f) after intravenous injection of Magnevist, FeGd-HN3, or FeGd-HN3-RGD2. The Gd dosage is 5.0 mg / kg. The MR images before injection are identified as 0 h in a-c. The signal changes in tumors at different time points after contrast administration are quantified using ΔSNR. The color bar is the same for Figure 5 a, b, c.
