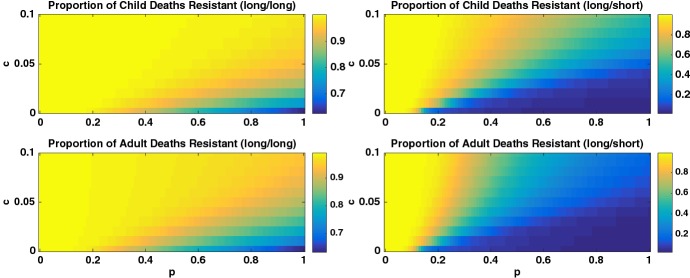
Fig. 8.
Heatmap of the proportion of deaths from the resistant strain for the high transmission region and for (left column: (long/long) scenario) long half-life drug for symptomatic treatment and (right column: (long/short) scenario) short half-life drug for symptomatic treatment. The top and bottom rows illustrate the proportion of child and adult deaths, respectively. Note different scales for the two columns. The proportion of deaths from the resistant strain is dependent on both p and c, showing that IPT schedule can increase resistance (Colour figure online)

