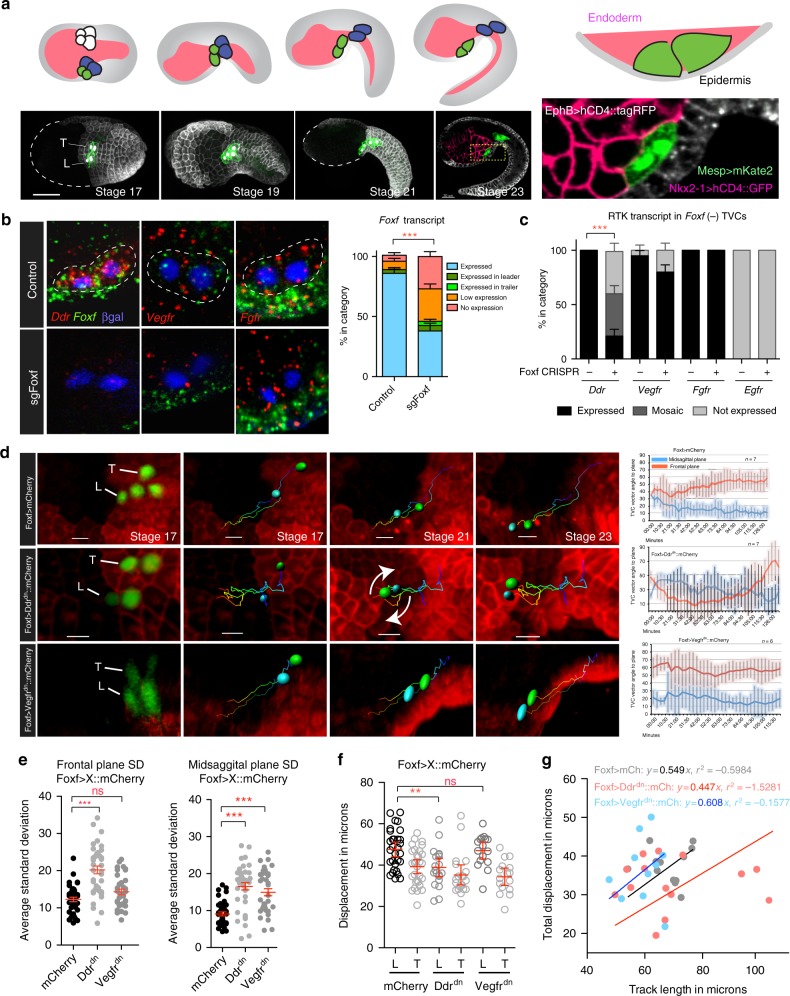
Fig. 1.
Ddr and Vegfr regulate TVC migration. a Schematic of TVC migration between endoderm and epidermis. TVCs (green), ATMs (blue), endoderm (pink), and epidermis (gray). Lower panel shows micrographs of TVC migration during development. Epidermal cells are marked with EfnB > hCD4::mCherry, B7.5 lineage marked with Mesp > hCD4::GFP and nuclear Mesp > H2B::mCherry for stages 17–19, markers used for 3-channel acquisition at stage 23 are given on magnified image. Magnified image shows the positioning of the TVCs between the endoderm and epidermis. Scale bar = 60um. b Fluorescent in situ hybridization (FISH) in migrating TVCs under control (EbfCRISPR, n = 101) and CRISPR (n = 118) targeting the Foxf locus. Micrographs are oriented with leader TVC to the left. TVC pair outlined with dotted lines and nuclei marked with Mesp > LacZ and stained for β-galactosidase. Quantification of Foxf knockout efficiency is shown to the right. Standard error of proportion is shown, statistical analysis using the Χ2 test. c RTK mRNA expression in proportion of embryos that lose Foxf expression. sgRNAs targeting the EBF locus used as control. Standard error of proportion and statistical significance is shown using the Χ2 test. For b, c, the data are pooled from three biological replicates. d TVC migration path tracking. TVC and ATM nuclei are marked with Mesp > H2B::GFP and epidermis with EfnB > hCD4::mCherry. Tracks of migrating TVCs shown in each panel, cyan sphere = leader, green sphere = trailer. Arrows highlight tumbling of TVCs. Average angle of L/T axis to sagittal and frontal planes are shown with standard deviation. e Average standard deviation of TVC position at the sagittal and frontal planes. Statistical analysis using one-way ANOVA. S.E.M. is shown. f Average displacement of leader/trailer TVCs measured from anterior ATM. Statistical analysis using two-way ANOVA and Bonferroni post-test. 95% C.I. is shown. The data are pooled from two biological replicates. g Relationship of total TVC displacement and track length. The data are derived from live imaging shown in subset d. For the regression, line is forced to go through the origin. Slope of the line represents track straightness calculated as displacement divided by total track length. For all graphs, *p < 0.05, **p < 0.005, ***p < 0.0005. L leader, T Trailer

