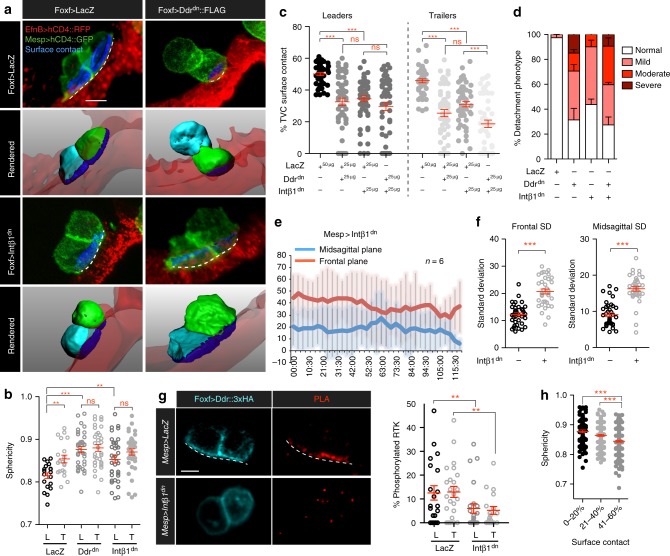
Fig. 2.
Integrin-β1 and Ddr promote TVC adhesion to the ventral epidermis. a Micrographs of surface contacts made by migrating TVCs with the underlying epidermis. Surface contacts are shown in blue. The length of the surface contact is indicated with a dashed line. TVCs are marked and segmented based on the B7.5 linage-specific expression of Mesp > hCD4::GFP and epidermal surface is visualized with EfnB > hCD4::RFP. Lower panels show rendered surfaces, leader is shown in cyan, trailer in green, epidermal surface in transparent red. For segmentation and derivation of surface contacts see Materials and Methods. Scale bar = 10 μm. b TVC sphericity under adhesion perturbation. The data are pooled from three biological replicates. Statistical analysis using two-way ANOVA followed by the Bonferroni post test. S.E.M. is shown. c TVC surface contact under adhesion perturbation. All transgenes are expressed from the Foxf TVC-specific enhancer. Results shown are pooled from 3 biological replicates. Statistical analysis using two-way ANOVA followed by the Bonferroni post hoc test. S.E.M. is shown. d Interaction of Ddr and Intβ1 adhesion pathways. Bar graph shows percent detachment phenotype detected under each condition. Standard error of proportion is shown. e Quantitation of migration angles of Mesp > Intβ1dn expressing TVCs, averages at each time point and standard deviation shown. f Average standard deviation relative to the frontal and sagittal planes of Mesp > Intβ1dn expressing TVCs. Statistical analysis using the Wilcoxon rank sum test. S.E.M. is shown. g Proximity ligation assay (PLA) of phosphorylated full-length Ddr under control and Intβ1dn conditions. Quantitation of phosphorylated Ddr compared to the total expression of Ddr. Statistical analysis using a two-way ANOVA followed by the Bonferroni post hoc test. S.E.M is shown. Scale bar = 10 μm. h Changes in sphericity associated with reduction in TVC/epidermis surface contact. Data is pooled from all cells analyzed in data sets for (b, c). Statistical analysis using a one-way ANOVA followed by the Tukey post-test. S.E.M. is shown. For b–d, g, h, all the data are pooled from 3 biological replicates. All images are oriented with leader TVC to the left. *p < 0.05, **p < 0.005, ***p < 0.0005. L leader, T Trailer

