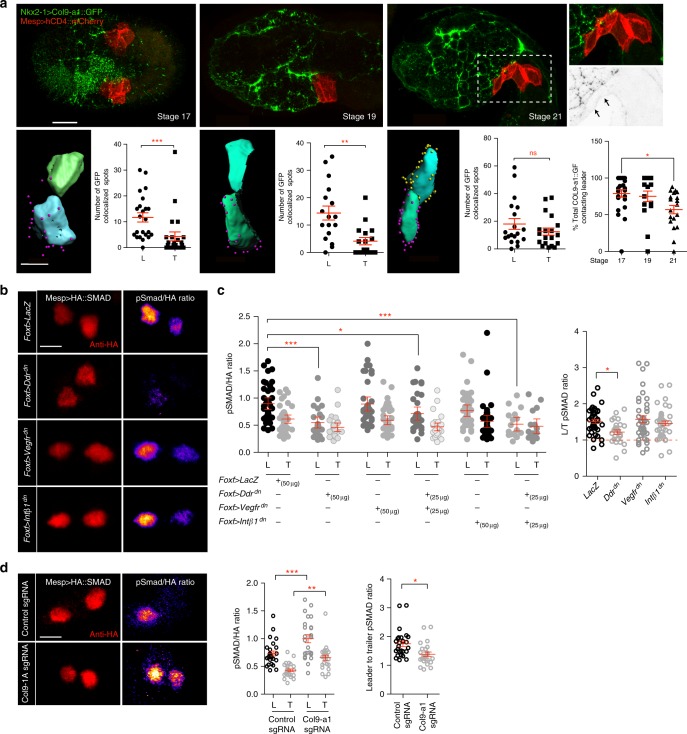
Fig. 6.
Asymmetric exposure to Col9-a1 polarizes TVCs through an adhesion-independent function of Ddr. a Distribution of Col9-a1::GFP expressed in the endoderm at stages 17–21, prior to and at onset of TVC migration. Boxed region show localization of Col9-a1::GFP fusion ventral to migrating TVCs at stage 21. Arrows point to ventral accumulation of Col9-a1::GFP. Calculation of total exposure of leader or trailer to endodermal collagen at each embryonic stage. Presumptive leader = blue, presumptive trailer = green. Purple spheres indicate collagen spots proximal to the leader TVC, yellow spheres are proximal to the trailer TVC. Scatter plots show total number of collagen contact sites for leader or trailer at each given time point. Statistical analysis using the Wilcoxon Rank Sum test. Last scatter plot shows total number of Col9-a1::GFP spots contacting leader TVC over time. Statistical analysis using a one-way ANOVA followed by the Tukey post test. S.E.M. is shown. Whole embryo scale bar = 30 μm, rendered image scale bar = 15 μm. b Quantitation of pSmad activity under conditions perturbing TVC adhesion. Ratios between the pSmad and HA channels are calculated by dividing the intensity of the pSmad channel by the intensity of the HA channel. Ratio is color-coded using the Fire Look Up Table (LUT) with lighter colors indicating a higher ratio. Scale bar = 5 μm. c Normalized levels of pSmad in L/T under perturbation conditions and ratios of total leader:trailer pSmad levels. Statistical analysis using two-way ANOVA followed by the Bonferroni post hoc test and one-way ANOVA followed by the Tukey post hoc test. d pSMAD staining of control migrating TVCs and TVCs under endodermal Col9-a1 CRISPR mutagenesis conditions. L:T ratios and normalized L/T pSmad levels are shown to the right. Statistical analysis using two-way ANOVA followed by Bonferroni post hoc test for normalized pSMAD levels and Wilcoxon Rank Sum test for leader/trailer ratios. S.E.M. is shown. For a,d,data is pooled from two biological replicates, for c data is pooled from three biological replicates. Scale bar = 5μm. All images are oriented with leader TVC to the left. *p < 0.05, **p < 0.005, ***p < 0.0005. L leader, T Trailer

