
Figure 7.
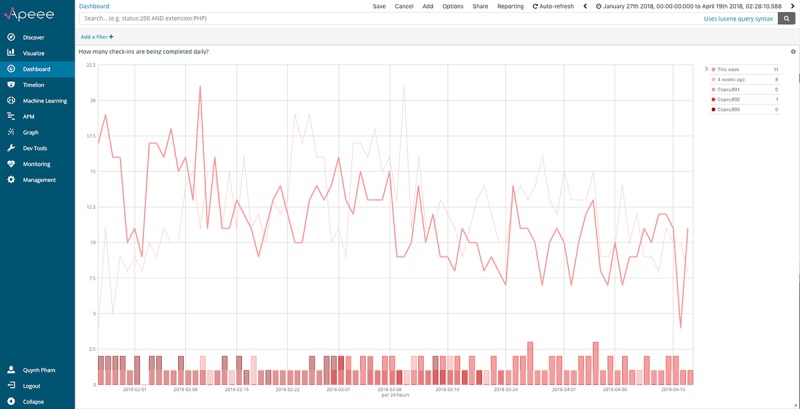
The analytic indicator for “how many check-ins are being completed daily?,” visualized through APEEE as a histogram with 3 layered graphs. APEEE: Analytics Platform to Evaluate Effective Engagement.
Official websites use .gov
A
.gov website belongs to an official
government organization in the United States.
Secure .gov websites use HTTPS
A lock (
) or https:// means you've safely
connected to the .gov website. Share sensitive
information only on official, secure websites.
The analytic indicator for “how many check-ins are being completed daily?,” visualized through APEEE as a histogram with 3 layered graphs. APEEE: Analytics Platform to Evaluate Effective Engagement.