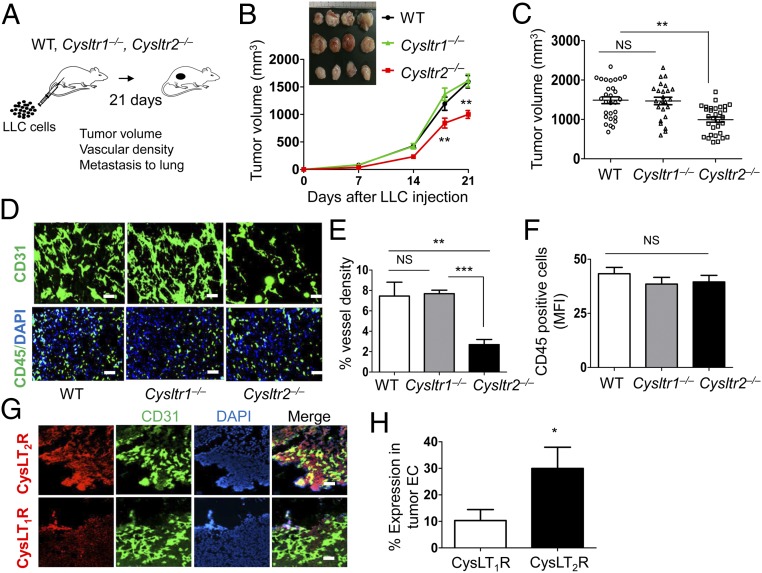
Fig. 3.
Genetic deletion of CysLT2R inhibits tumor angiogenesis and growth. (A) Cartoon showing the outline of tumor experiment. LLC cells (2 × 10⁶ in 100 μL of PBS) were injected s.c. into both flanks of the indicated mouse groups. On day 21, mice were euthanized, tumor volume was measured, and primary tumors were harvested for histological studies. (B) Time-dependent change in tumor growth (volume) in the indicated mouse groups. (Inset) Photographs of primary tumors. (C) Tumor volumes of indicated mouse groups at day 21. (D) Representative fluorescence images showing vessel density (CD31, green) and CD45+ cells (CD45, green; DAPI, blue) in tumor sections from indicated mouse groups. (Scale bars: 100 μm.) (E) Quantification of vessel density from D. (F) Quantification of CD45+ cells from D. (G) Immunofluorescence images of tumor sections from WT mice showing the expression of CysLT1R and CysLT2R (red) in the tumor vessels (CD31, green). Nuclei were stained with DAPI (blue). (n = 5 per group). (Scale bars: 100 μm.) (H) Quantification of CysLT1R and CysLT2R expression in tumor vasculature. Data are shown as mean ± SEM. *P < 0.05; **P < 0.01; ***P < 0.001; NS (nonsignificant) as determined by one-way ANOVA with a Tukey post hoc test or the Mann–Whitney U test (in H).

