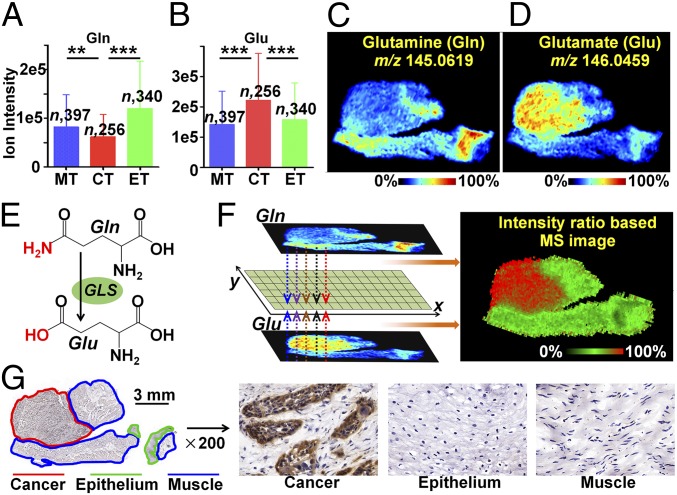
Fig. 4.
In situ visualization of crucial metabolites and metabolic enzyme in the glutamine metabolism pathway. (A and B) Glutamine (Gln) and glutamate (Glu) levels in cancer and paired epithelium and muscle tissues from 256 ESCC patients (means ± SD). **P < 0.01; ***P < 0.001. (C and D) MS images of Gln and Glu in ESCC tissue section. (E) GLS-mediated metabolic process of converting Gln to Glu. (F) The newly constructed MS image based on the ion-intensity ratio of Glu to Gln. (G) Expression of GLS in different regions of the ESCC tissue section. CT, cancer tissue; ET, epithelial tissue; MT, muscular tissue.

