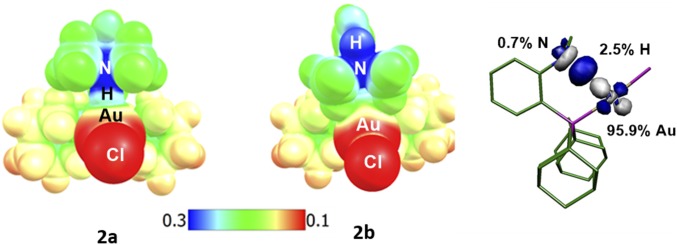
Fig. 3.
Electrostatic potential maps for 2a (Left, with the N–H bond pointing and hydrogen-bonded toward Au) and 2b (Center, with the N–H bond pointing opposite to Au) plotted over the range 0.1 a.u. (red) to 0.3 a.u. (blue). The isosurfaces are drawn at 0.002 e.a.u.−3. (Right) Superposition of the donor and acceptor NBO orbitals (cutoff = 0.08) involved in the N–H∙∙∙Au interaction; percent participation of each atom in the associated natural localized molecular orbital is noted.

