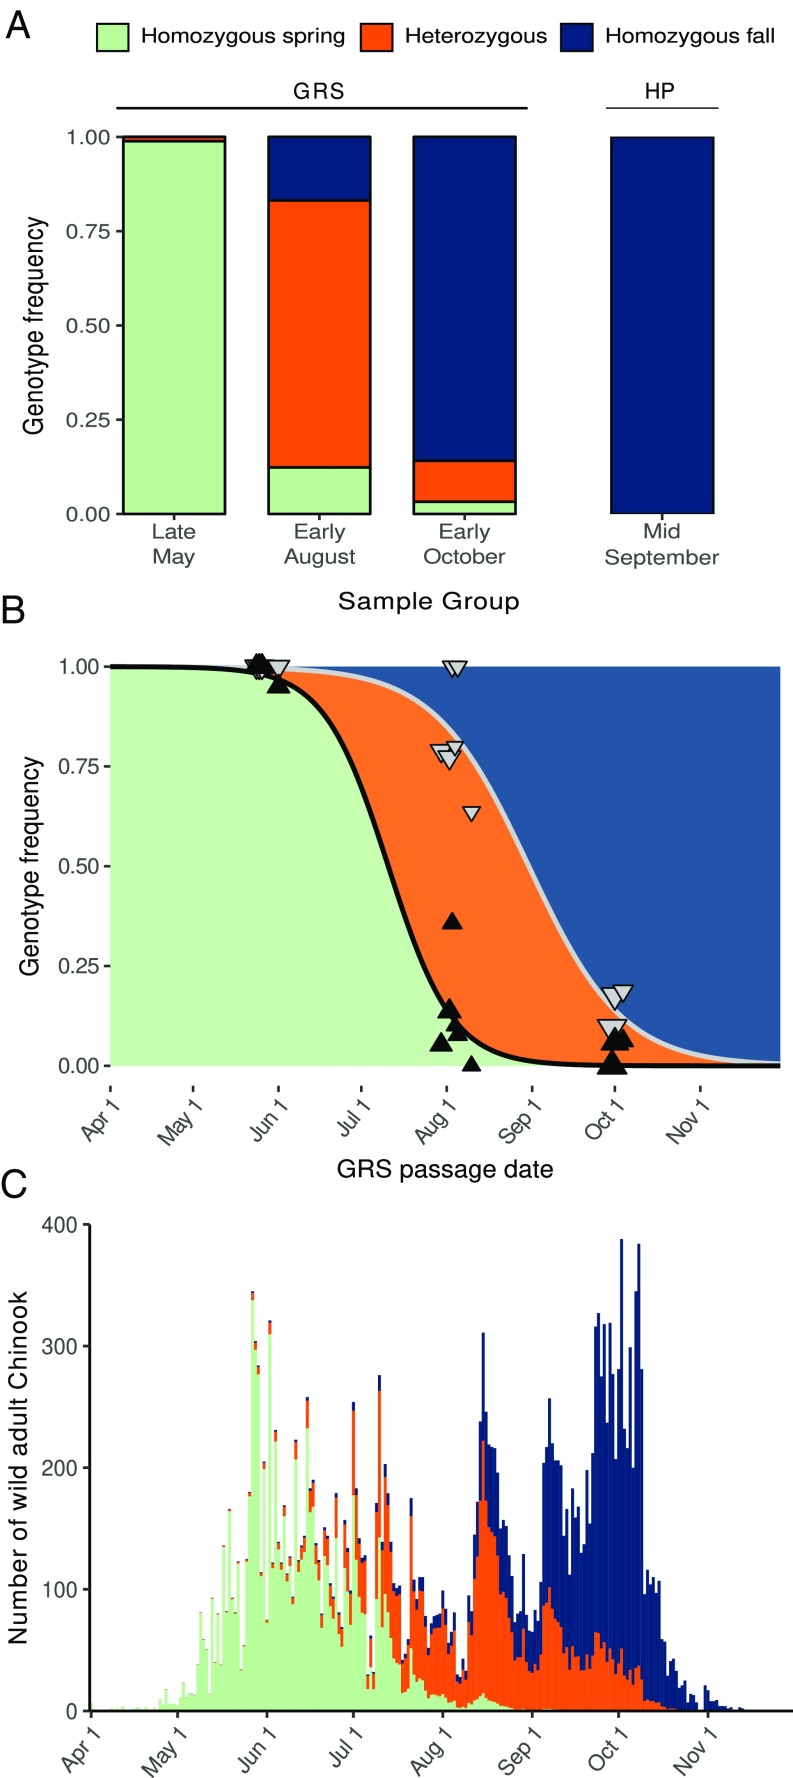
Fig. 2.
Genetic basis of adult migration phenotype in Rogue River Chinook. (A) Stacked bar graph representing observed GREB1L genotype frequencies in GRS and HP sample groups. (B) Scatter plot representing observed GREB1L genotype frequencies in GRS samples across 13 collection days; triangles represent homozygous spring-run (black) and homozygous spring-run plus heterozygous (gray) genotype frequencies; triangle size is proportional to the number of fish analyzed each day (minimum 10, maximum 42). For fish that pass GRS during a specific time interval (e.g., a single day), the area below the black line represents the expected frequency of the homozygous spring-run genotype, the area between the lines represents heterozygotes, and the area above the gray line represents the homozygous fall-run genotype. (C) Stacked bar graph representing number of wild adult Chinook passing GRS in 2004; colors represent estimated proportion of each GREB1L genotype.

