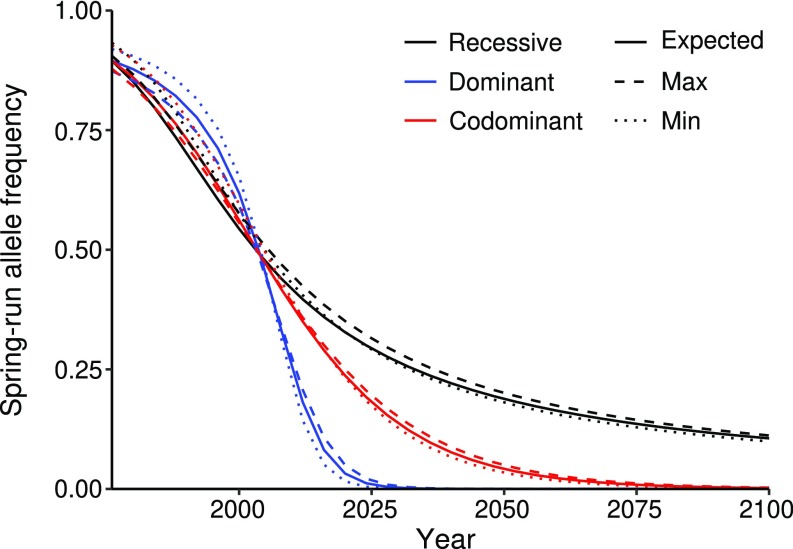
Fig. 3.
Selection modeling in Rogue Chinook. Line graph representing the spring-run allele frequency over time under recessive, dominant, and codominant scenarios. Estimated spring-run allele frequencies in 1976 (1 y before LCD construction) and 2004 were used to determine selection coefficients for each scenario [recessive: sFF = sSF = 0, sSS = 0.367; dominant: sFF = 0, sSF = sSS = 0.646; codominant: sFF = 0, sSF = 1/2(sSS), sSS = 0.447]. The modeling assumes random mating and no genetic drift.

