Fig. 2.
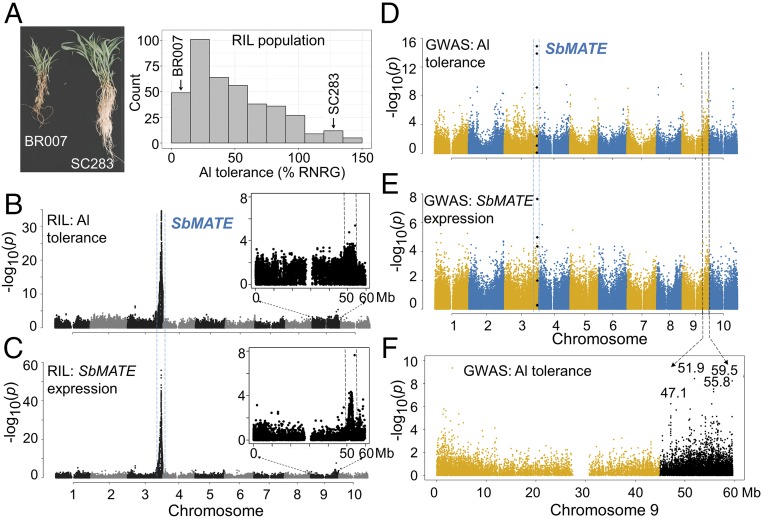
Trans-factor positional cloning based on expression GWAS. (A) Contrasting phenotypes in BR007 (Al-sensitive) and SC283 (Al-tolerant) based on root damage and relative net root growth (%RNRG) assessed in nutrient solution with {27} µM Al3+, in the context of the BR007 × SC283 RILs. QTL mapping was carried out for (B) Al-tolerance and (C) SbMATE expression (eQTL) in the BR007 × SC283 RILs. The chromosome 9 region, where a colocated Al-tolerance/eQTL was detected, is expanded. GWAS with (D) Al tolerance and (E) SbMATE expression. SNPs near or within SbMATE previously associated with Al tolerance (20) are depicted as black diamonds. Blue and black dashed lines indicate the SbMATE region (chr 3) and the region harboring significant SNPs on chromosome 9, respectively, which overlap in the RIL QTL map (B and C) and in the GWAS plots (D and E). (F) Details of the chromosome 9 region showing physical positions for SNPs with the strongest association signals with Al tolerance (black dots).

