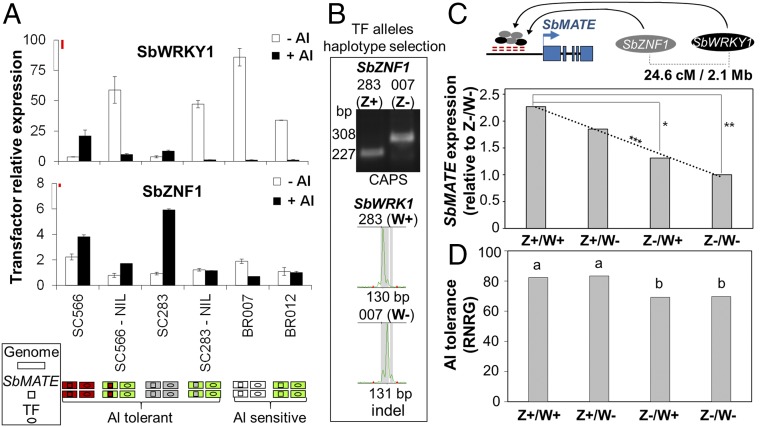
Fig. 4.
Transcription factor expression profile and effect on SbMATE expression and Al tolerance. (A) SbWRKY1 and SbZNF1 expression in Al-tolerant (SC283 and SC566) and Al-sensitive (BR007 and BR012) lines, and in the SC566-NIL and SC283-NIL (SC566/SC283 SbMATE in the BR012 background). Colored schematics indicate the genetic backgrounds (genome, rectangles), the SbMATE alleles (squares), and TF alleles (ovals), along with the Al tolerance phenotype (7). Plants were grown on ±{27} µM Al3+ for 5 d in nutrient solution at pH 4.0 (brackets denote free Al3+ activity estimated with GEOCHEM; see SI Appendix, Supplementary Methods), and the root apices (1 cm) were collected. Values are mean ±SD (n = 2). Least significant difference (Fisher’s LSD, α = 0.10) bars (in red) are drawn to scale (Top of the y axis). This experiment was repeated with similar results (SI Appendix, Fig. S6, 5 d; n = 3). (B) SbWRKY1 and SbZNF1 polymorphisms in the RIL parents, BR007 (007, Al-sensitive) and SC283 (283, Al-tolerant), which were used to select RILs with all combinations of TF alleles (i.e., TF haplotypes). (C) SbWRKY1 and SbZNF1 effect on SbMATE expression estimated based on RILs homozygous for the SC283 (Al-tolerant) alleles at both TF loci (Z+/W+), for the BR007 (Al-sensitive) allele (Z−/W−), or showing alternate TF alleles (Z+/W− and Z−/W+). Significant differences based on 5% (**) and 12% (*) confidence intervals. A linear regression model fit to haplotype SbMATE expression was highly significant (***α = 0.01). Physical (Mb) and genetic (cM) distances between TFs are depicted at the Top. (D) Effect of SbWRKY1 and SbZNF1 on Al tolerance as measured by relative net root growth (%RNRG). Different letters indicate statistical differences (Fisher’s least significant difference, α = 0.08).

