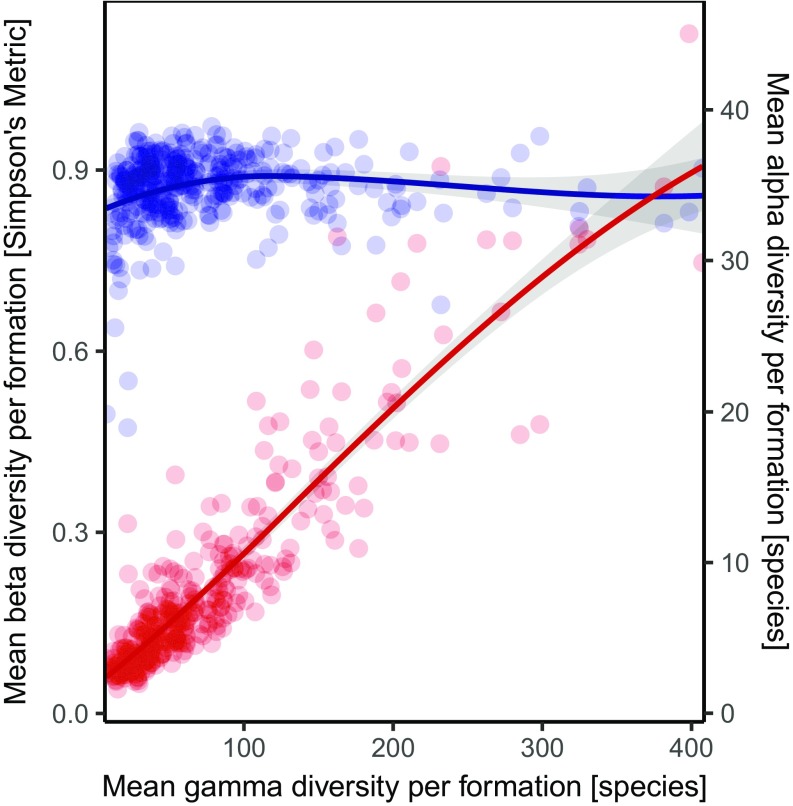
Fig. 1.
Alpha–beta–gamma-plot showing the influence of alpha (red) and Simpson’s metric as a measure for beta diversity (blue) to generate gamma diversity of all Phanerozoic geological formations. Gray areas represent the 95% confidence intervals of curve fits (Loess fit, bold lines). Gamma diversity change is proportional to alpha diversity (red line). Beta diversity (blue line) appears to have a neutral relationship to gamma diversity. Y axes refer to mean species richness of the collections of a formation (i.e., alpha diversity) and to Simpson’s metric, respectively.

