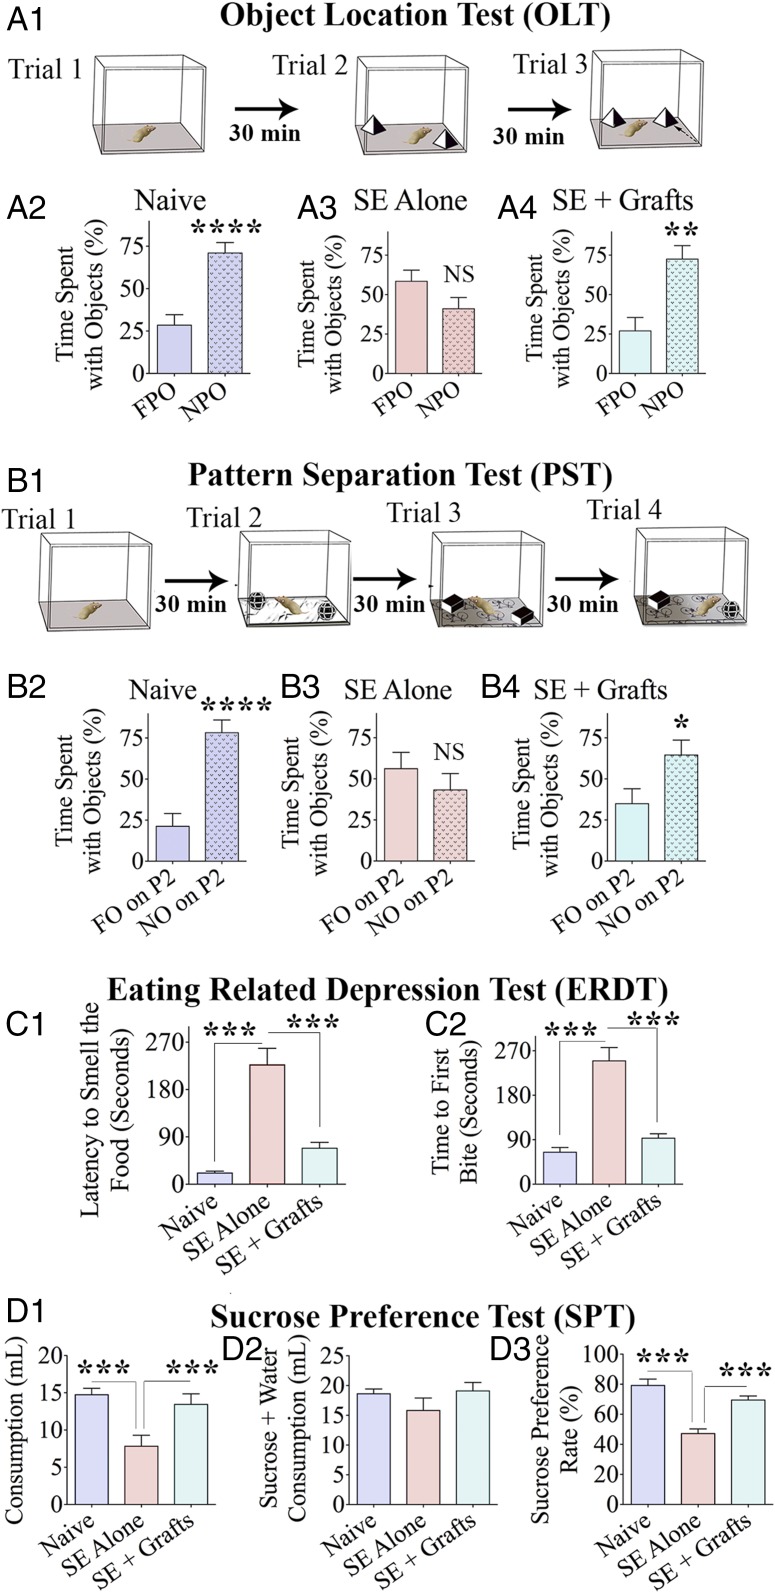
Fig. 3.
hMGE-like cell grafting into the hippocampus after SE maintained better cognitive and mood function in the chronic phase. The various phases (trials) involved in an OLT (A1) and a pattern separation test (PST; B1) are graphically depicted. (A2–A4 and B2–B4) Bar charts compare percentages of time spent with different objects (n = 6–10 per group). Bar charts compare latencies to smell food (C1) and the first bite of food (C2) in an ERDT between the three groups of animals (n = 6–10 per group). (D1–D3) Bar charts show data from a sucrose preference test (SPT), which is a test for measuring anhedonia. The bar chart in D2 compares the amount of total liquid (sucrose + water) consumption between groups. *P < 0.05; **P < 0.01; ***P < 0.001; ****P < 0.0001; NS, not significant.

