Fig. 6.
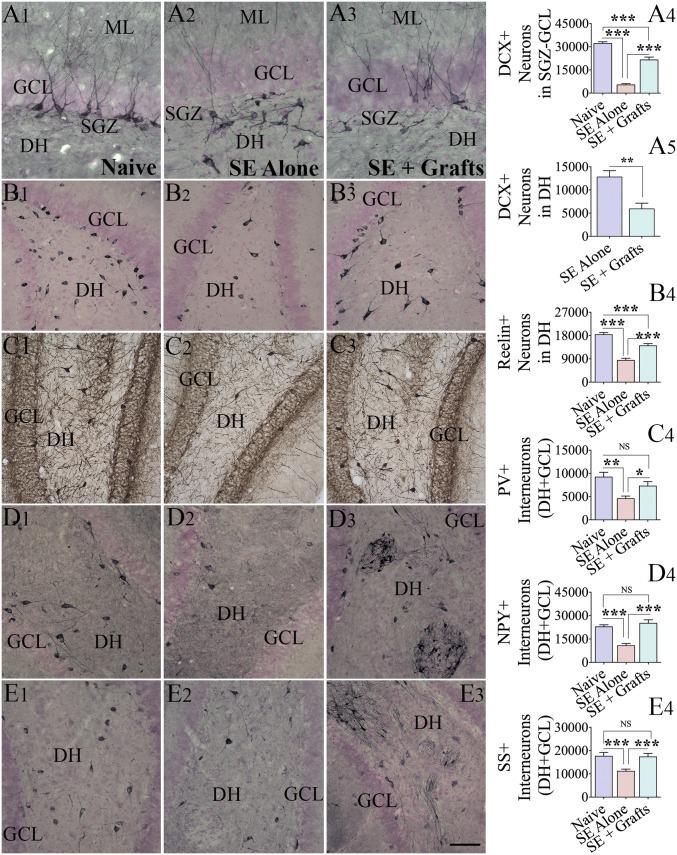
hMGE-like cell grafting after SE maintained higher levels of normal neurogenesis with reduced abnormal neurogenesis and diminished the loss of various subclasses of host interneurons. Distribution and density of DCX+ newly born neurons in the subgranular zone (SGZ)-GCL and the dentate hilus (DH) (A1–A3) and reelin+ interneurons in the DH (B1–B3) from representative animals belonging to naive (first column), SE-alone (second column), and SE + grafts (third column) groups are illustrated. Bar charts compare numbers of DCX+ neurons in the SGZ-GCL (A4; normal neurogenesis) and the DH (A5; abnormal neurogenesis). (B4) Bar chart compares the number of reelin+ interneurons between different groups (n = 5 per group). The distribution and density of interneurons expressing PV (C1–C3), NPY (D1–D3), and SS (E1–E3) in the DH and GCL of representative animals belonging to naive (first column), SE-alone (second column), and SE + grafts (third column) groups are illustrated. Arrows in D3 and E3 denote clusters of NPY+ and SS+ interneurons derived from hMGE grafts. (C4, D4, and E4) Bar charts compare numbers of PV+, NPY+, and SS+ interneurons in DH + GCL between different groups (n = 5 per group). The numbers include both graft-derived interneurons and host interneurons in these charts. The numbers of host interneurons only are shown in SI Appendix, Fig. S6. ML, molecular layer; NS, not significant. *P < 0.05; **P < 0.01; ***P < 0.001. (Scale bars: A1–A3, 100 μm; B1–B3, C1–C3, D1–D3, and E1–E3, 200 μm.)

