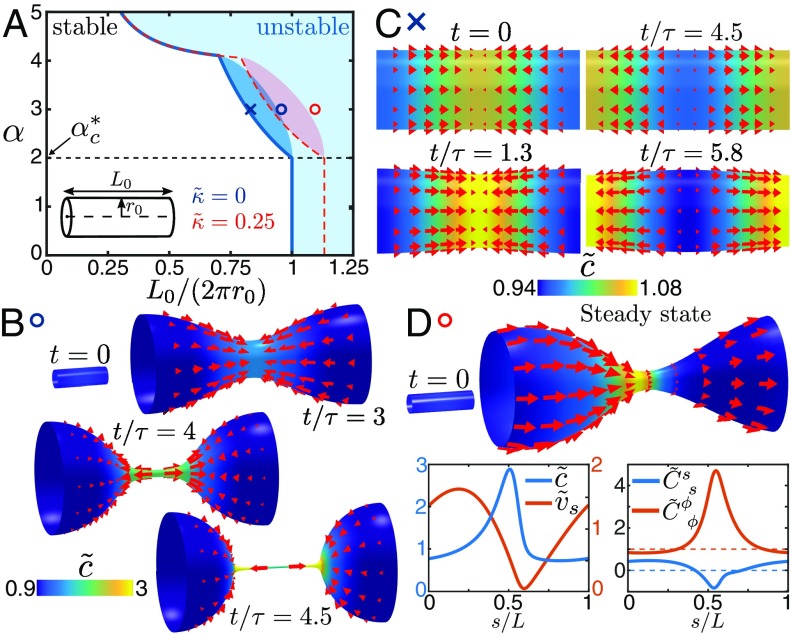
Fig. 3.
Shape dynamics of tubular active fluid surfaces with concentration-dependent active tension. (A) Representative stability diagram of the system. Stable and unstable regions are separated by the blue curve for and the red dashed line for , where . For the dark blue-shaded region indicates parameter regimes where eigenvalues of the Jacobian are complex. The critical contractility (Eq. 27) is described in the main text. (B) Concentration and in-plane flow (red arrows) during the spontaneous formation of a contractile ring (Movie S3) for parameters indicated with a blue circle in the stability diagram (, not to scale). This mechanism can constrict surfaces with aspect ratios below the Rayleigh threshold of . (C) Concentration and in-plane flow over one oscillation period for parameters indicated with a blue cross in the stability diagram (Movie S4). Oscillations result from the interplay between geometric stability of cylinder surfaces with and the mechanochemical instability of the active fluid film. Surface flows in B and C are shown in the reference frame where (SI Appendix). (D) Steady state of directed surface flows relative to a constricted shape ( not to scale). Shown are concentration (color code as in B), in-plane flow (), and principle curvatures , . The surface flow is shown in the reference frame where the constriction does not move (SI Appendix). In the reference frame where , this steady state resembles peristaltic motion (Movie S5). The parameters used in these simulations are given in SI Appendix.

