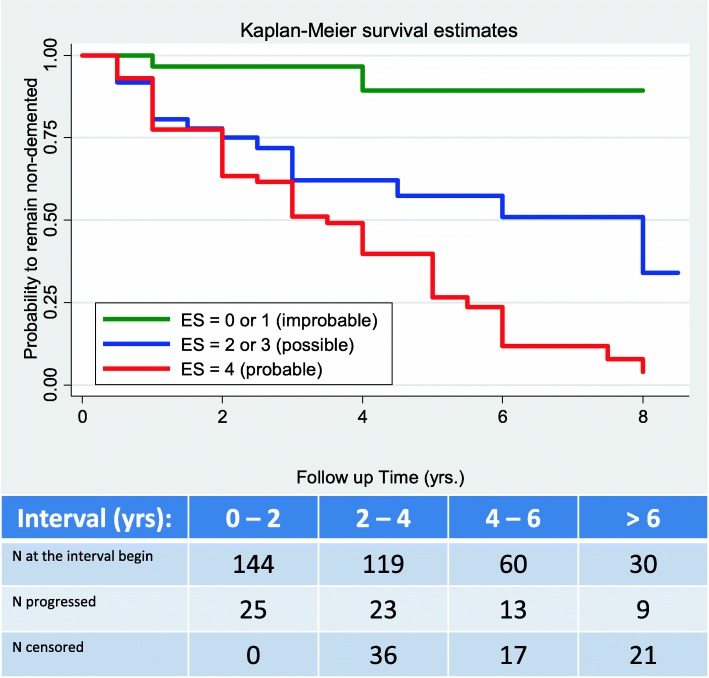
Fig. 1.
Kaplan–Meier survival curves of the three Erlangen Score (ES) categories. Note overlapping “possible” and “probable” curves in first 3 years, which then split apart with “possible” curve parallel to “improbable” curve. Table shows number of patients at beginning of each 2-year time interval, and numbers of patients having progressed to ADD or having been lost (censored) during each interval

