Fig. 2.
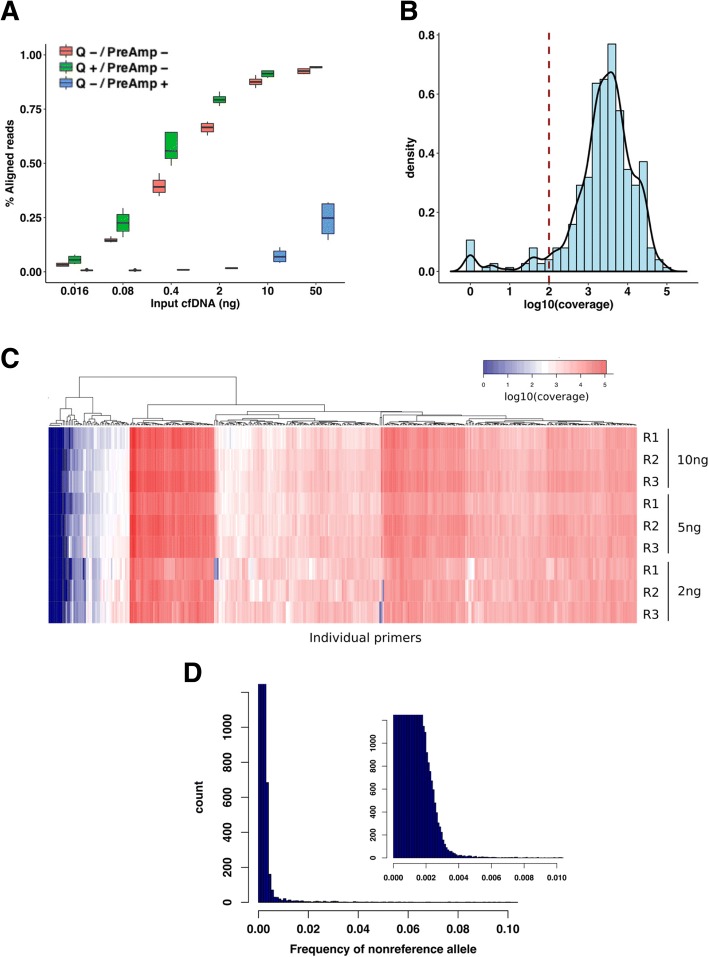
Optimising targeted deep sequencing by NG-TAS. a Percentage of aligned reads was compared in different samples where a variable amount of input control genomic DNA was used (range 50 to 0.016 ng). The effect of pre-amplification and Q solutions are shown, red = no Q solution and no pre-amplification step, green = with Q solution and no pre-amplification, blue = no Q solution and with pre-amplification. b Density plot showing the log10 coverage values for all primers in the 10 ng NA12878 cfDNA sample. The dotted line indicates 100× coverage; median value for the distribution is 3064×. c Coverage heatmap of individual primers for a different amount of input NA12878 cfDNA. For each amount of input DNA, the analysis was performed in triplicate. d Distribution of all non-reference base frequencies across all target regions in the NA12878 dilution series in c; the smaller plot on the right is a magnification of the main plot between 0 and 0.01

