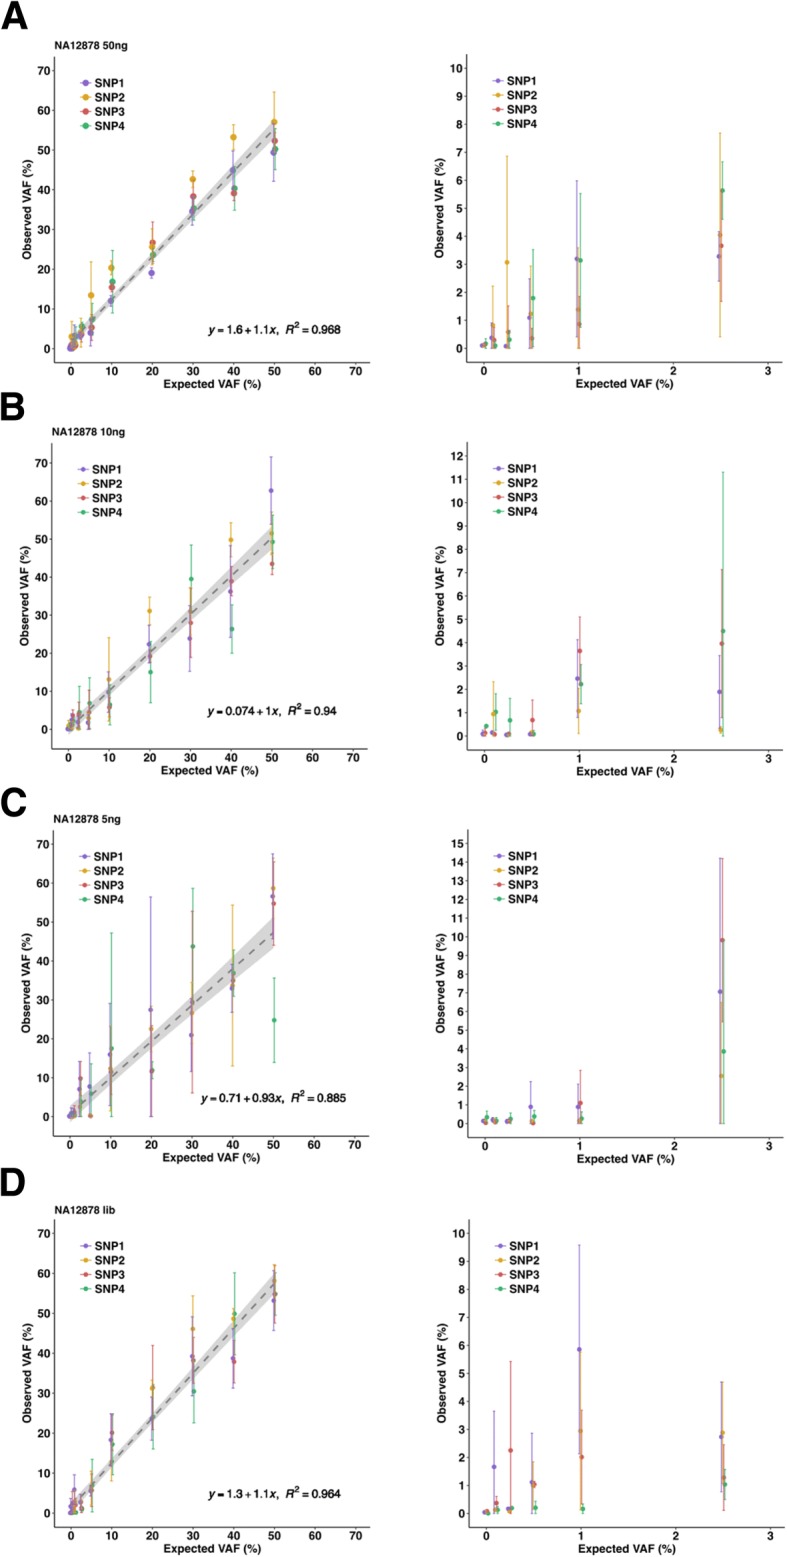
Fig. 3.

Detection of SNVs in NA12878 cfDNA dilution series. a Expected versus observed VAF for four SNVs in the NA12878-NA11840 dilution series starting from 50 ng input DNA (left) and zoom-in for expected VAF < 5% (right). b Expected versus observed VAF for four SNVs in the NA12878-NA11840 dilution series starting from 10 ng input DNA (left) and zoom-in for expected VAF < 5% (right). c Expected versus observed VAF for four SNVs in the NA12878-NA11840 dilution series starting from 5 ng input DNA (left) and zoom-in for expected VAF < 5% (right). d Expected versus observed VAF for four SNVs in the NA12878-NA11840 dilution series starting from post-NGS library input DNA (left) and zoom-in for expected VAF < 5% (right)
