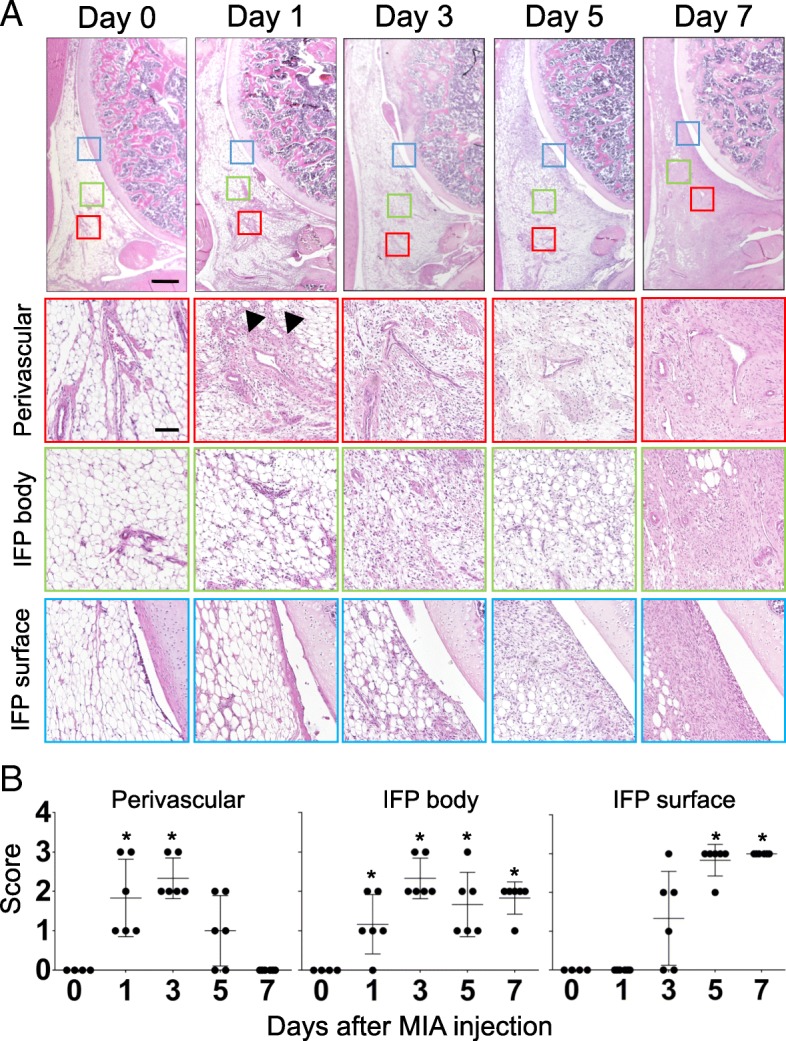
Fig. 3.

Time course histological changes of IFP (Cellularity). (a) Hematoxylin-eosin (HE) staining of sagittal section of the right knee joint (Top: Proximal, Left: Anterior). Boxed area in the top panels (Red: perivascular, Green: IFP body, Blue: IFP surface) are enlarged and shown below. Number of samples, day 0: n = 4, days 1, 3, 5, 7: n = 6. Scale bar, top panels: 500 μm, Second, third and bottom panels: 100 μm. Arrowheads indicate the initial hyperplastic changes in perivascular region. (b) Semi-quantitative evaluation of structural changes in IFP were performed according to the grading criteria described in Table 1. Three sections were randomly picked up from each sample and evaluated. Each dot indicated the mean value at each time point. Data were also indicated as mean and SD value. Number of samples in each time point, day 0: n = 4, days 1, 3, 5, 7: n = 6. Kruskal-Wallis test followed by Steel-Dwass test were performed to calculate if the difference was statistically significant. Asterisks indicated that P value was less than 0.05
