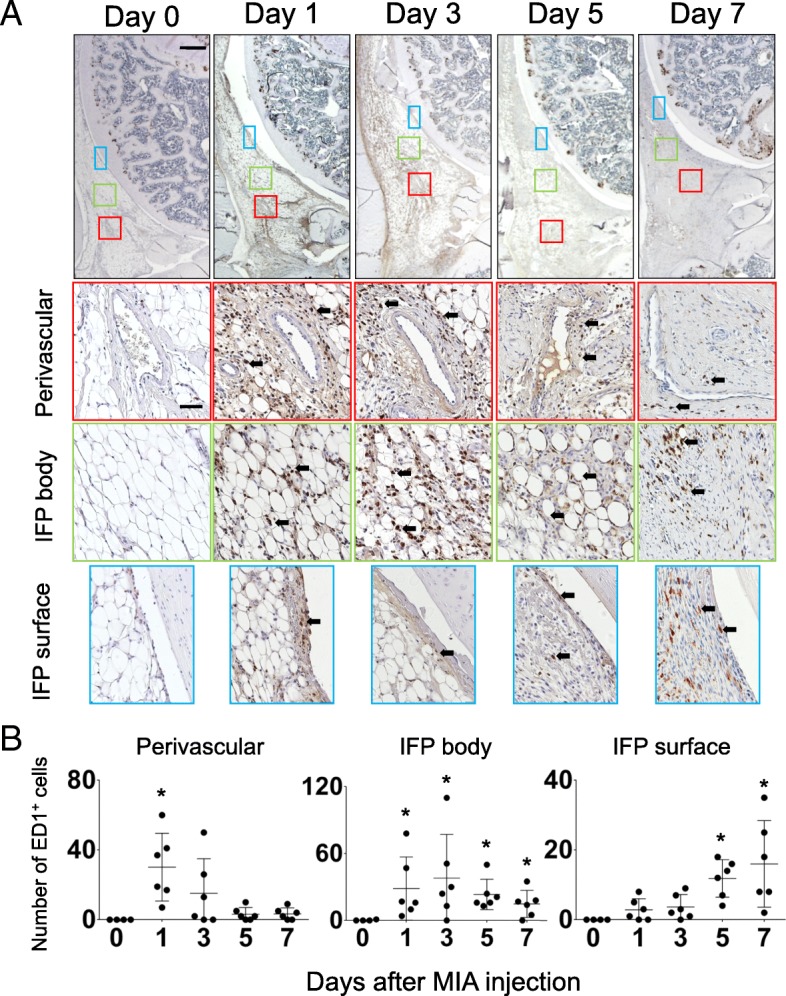
Fig. 4.

Time course changes of inflammatory cell infiltration in IFP. (a) Sagittal sections of the right knee joint (Top: Proximal, Left: Anterior) were stained with anti-rat ED1 antibody to identify macrophages infiltrated in IFP at each time point. Boxed area in the top panels (Red: perivascular, Green: IFP body, Blue: IFP surface) are enlarged and shown below. Number of samples, day 0: n = 4, days 1, 3, 5, 7: n = 6. Scale bar, top panels: 500 μm, Second, third and bottom panels: 50 μm. Arrows indicate examples of ED1-positive cells. (b) Numbers of ED1-positive macrophages in the boxed area were counted and plotted. Three sections were randomly picked up from each sample and evaluated. Each dot indicated the mean value of each time point. Data were also indicated as mean and SD value. Number of samples in each time point, day 0: n = 4, days 1, 3, 5, 7: n = 6. Kruskal-Wallis test followed by Steel-Dwass test were performed to calculate if the difference was statistically significant. Asterisks indicated that P value was less than 0.05
