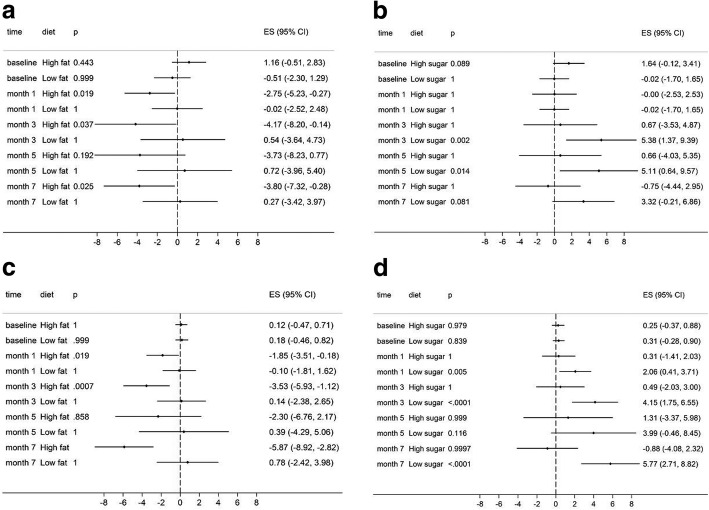
Fig. 2.
Forest plots showing excess sugar×fat interaction model estimates by five time points. ES stand for adjusted mean differences after analysis of linear mixed effects models adjusting body weight by time. Panel (a) shows mean differences of TC between HS and LS combined with HF or LF, Panel (b) shows mean differences of TC between HF and LF combined with HS or LS, Panel (c) shows mean differences of LDL-C between HS and LS combined with HF or LF, Panel (d) shows mean differences of LDL-C between HF and LF combined with HS or LS

