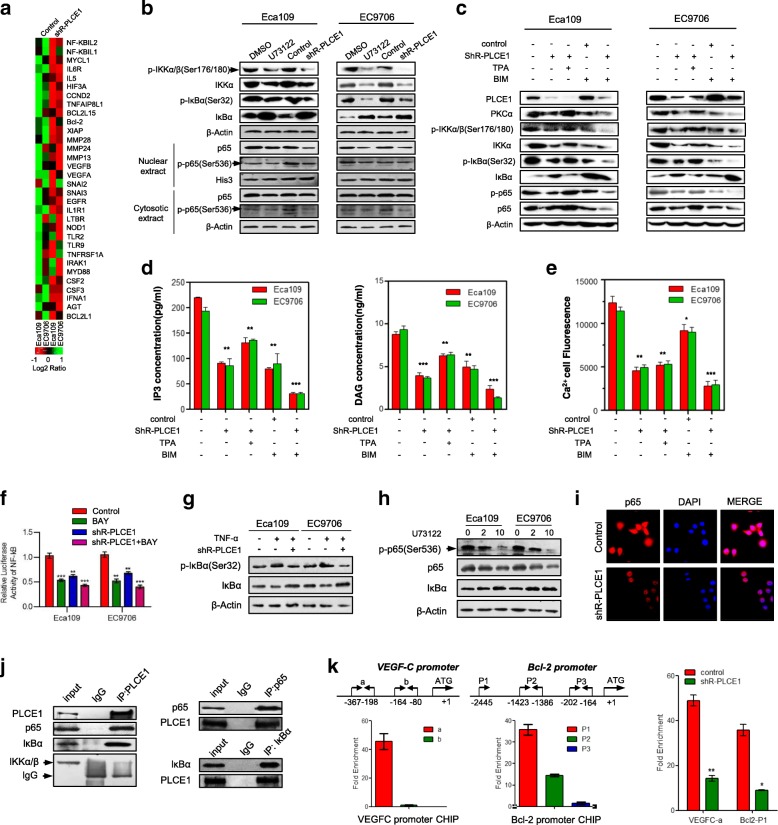
Fig. 4.
PLCE1 activates the NF-κB signaling pathway in ESCC. a Real-time PCR analysis shows overlap between NF-κB-dependent gene expression and PLCE1-regulated gene expression. Color represents intensity for vector of PLCE1 shRNA versus control, as calculated by log2 transformation. b Western blot for indicated proteins in indicated cells. c Western blot analysis was performed to indicate PLCE1 affect NF-κB signaling pathway through PI-PLCε pathway by using PLCE1 shRNA, TPA, and BIM. d ELISA assays showed the effects of PLCE1 shRNA, TPA, and BIM on intracellular levels of the PI-PLCε-pathway-related proteins IP3 and DAG. e Laser scanning confocal microscopy was used to measure intracellular calcium fluorescence pixel values of ESCC cells after treatment with PLCE1 shRNA, TPA, and BIM, which triggered positive and negative effects on the PI-PLC pathway. The histogram shows semi-quantitative analysis of fluorescence. f Activity of NF-κB luciferase reporter gene in ESCC cells expressed with indicated treatment. g IκBα and p-IκBα (Ser 32) in indicated cells. h Effects of 48 h U73122 treatment at 0, 2, and 10 concentrations on protein levels of phosphorylated p65 (Ser536); p65 and IκBα in ESCC cells. i IF analysis of Eca109 and EC9706 cells transfected with shR-PLCE1. Cells were fixed, stained with antibodies to p65 (red) and by 4′,6-diamidino-2-phenylindole (blue), incubated with appropriate secondary antibodies, and analyzed using double IF assays. j Whole cell lysates from Eca109 and EC9706 cells immunoprecipitated with antibodies against indicated proteins. k ChIP assay p65-binding sites on Bcl2 and VEGF-C genes. Extent of recruitment assessed by real-time PCR

