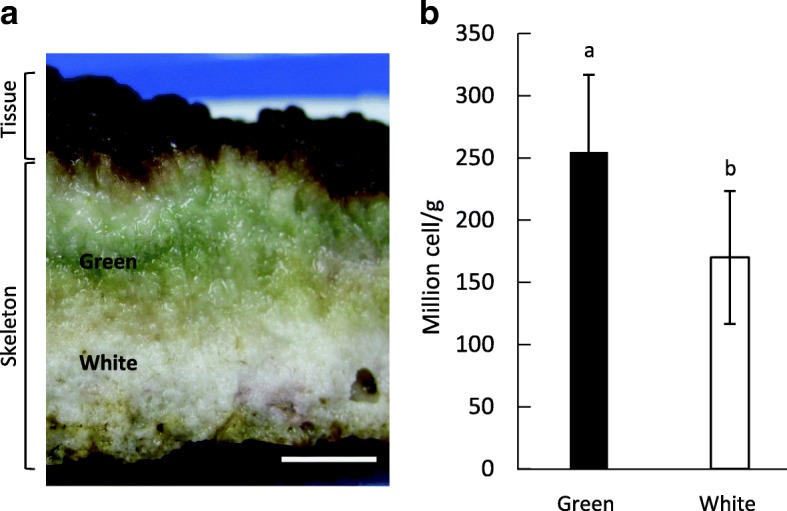
Fig. 1.

Skeleton of Isopora palifera and cell numbers within the skeleton. a The green layer was a green color constantly present in the CaCO3 skeleton beneath tissue in all colonies of I. palifera; the white layer was usual CaCO3 skeleton without a green color. The scale bar indicates 1 cm. b Average cell numbers from three colonies in the green and white layers. Different marks (a, b) indicate significant differences in cell number by student’s t-test between the layers (p = 0.0068, error bar = standard deviation)
