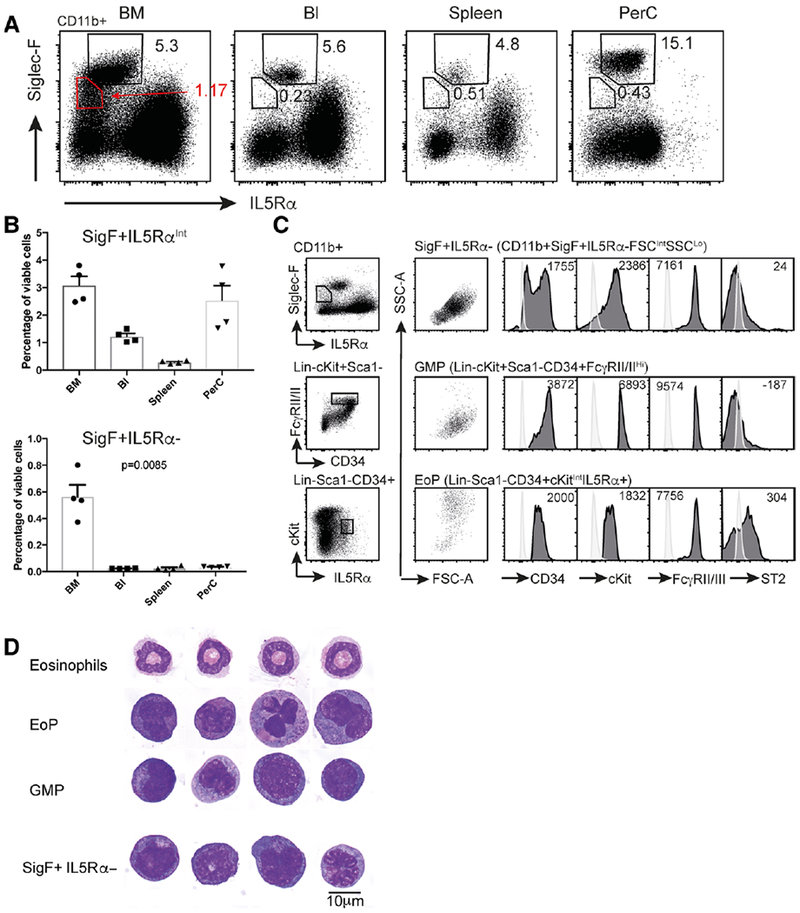
FIGURE 1. Identification and characterization of Siglec-F+ IL5Rα− cells.

(A) Flow cytometry dot plots showing Siglec-F and IL5Rα expression in CD11b+ viable cells in C57BL/6 bone marrow (BM), blood (Bl), spleen, and peritoneal cavity lavage fluid (PerC). Eosinophils (Siglec-F+ IL5RαInt) and Siglec-F+ IL5Rα− populations are gated. The percentage of cells falling within each gate are shown. (B) Quantification of Siglec-F+ IL5RαInt (eosinophil) and CD11b+ Siglec-F+ IL5Rα− cells (as a percentage of viable cells) in the 4 tissues shown in (A). Note, contaminating eosinophils in the CD11b+ Siglec-F+ IL5Rα− gate have been excluded from quantification on the basis of high side scatter. Data is presented as mean + sem (n = 4 mice), with individual mouse data points shown. p-values determined by one way ANOVA (C). Light scatter and surface marker expression in the CD11b+ Siglec-F+ IL5Rα− population, GMPs and EoPs. Cells in the surface marker histograms for the Siglec-F+ IL5Rα− population have been pregated to exclude any contaminating eosinophils on the basis of high side scatter. Light colored histogram represents the fluorescence of unstained BM cells. Numbers indicate the average geometric mean fluorescence for each surface marker from 4 independent mice (D) Representative images of sorted and cytocentrifuged populations following May Grunwald Giemsa staining. Ten micrometer scale bar shown
