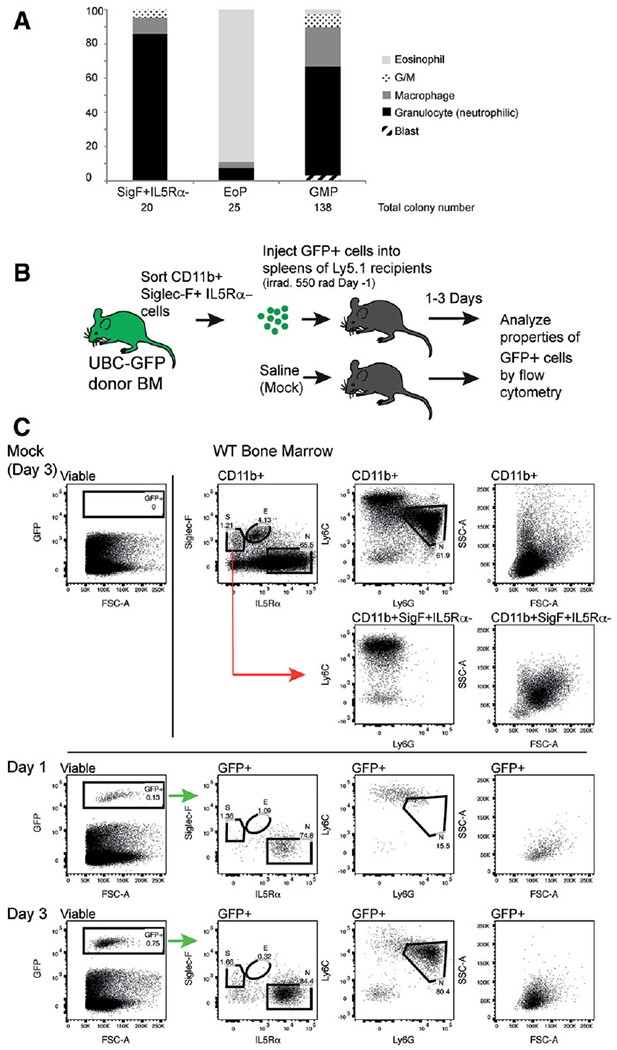
FIGURE 3. CD11b+ Siglec-F+ IL5Rα− cells predominantly develop into non-eosinophil granulocytes in vitro and in vivo.

(A) In vitro colony forming assay showing the percentage of each colony type formed when CD11b+ Siglec-F+ IL5Rα−, EoP and GMP populations are plated in soft agar with stem cell factor + IL3 + EPO. The total numbers of colonies formed by each cell type are indicated. G/M indicates mixed granulocyte/macrophage colonies. (B) Schematic representation of in vivo developmental potential assay (C) In vivo developmental potential assay. Top right panels show typical staining characteristics of CD11b+ cells in bone marrow. The positions of eosinophils (E), neutrophils (N) and the injected CD11b + Siglec-F+ IL5Rα− (S) population are shown on the Siglec-F/IL5Rα dot plot. Ly6C/Ly6G and FSC/SSC profiles of total CD11b+ cells are shown. The position of neutrophils (N) in terms of Ly6G and Ly6C expression is indicated. The Ly6C/Ly6G and FSC/SSC characteristics of gated CD11b+ Siglec-F+ IL5Rα− cells are also shown. Top left panel shows lack of GFP+ cells in a mock (PBS)-injected spleen, 3 days after surgery. Third row, the identification of GFP+ cells from the spleen 1 day post injection, and the surface marker expression and scatter characteristics of GFP+ cells. Bottom row, the identification of GFP+ cells from the spleen 3 days post injection, and the surface marker expression and scatter characteristics of GFP+ cells. The predicted positions of the starting population (S), eosinophils (E), and neutrophils (N), based on side-by-side staining of WT BM (top row), are shown
