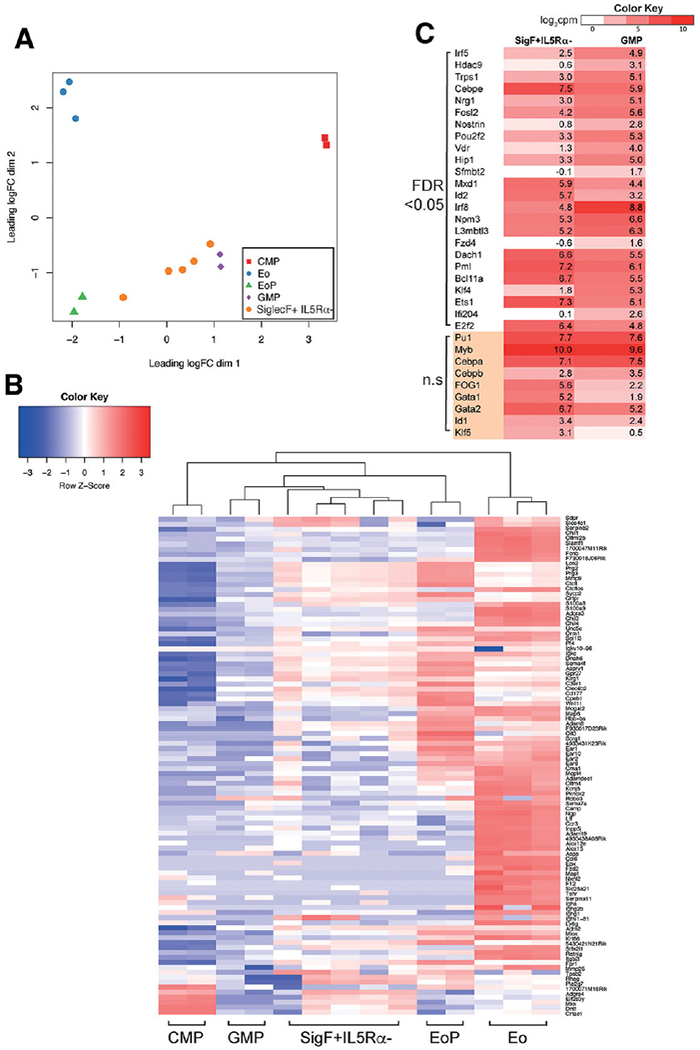
FIGURE 6. Siglec-F+ IL5Rα− cells are transcriptionally distinct from classical GMPs.

(A) Multidimensional scaling plot of the RNA-seq profiles from common myeloid progenitor (CMP), granulocyte-macrophage progenitor (GMP), eosinophil-lineage restricted progenitor (EoP), eosinophil (Eo), and Siglec-F+ IL5Rα− populations based on the 500 most variable genes between each pair of samples. (B) Heatmap and clustering of the top 100 most variable genes across the cell types shown in (A). The heatmap is colored according to row scaled gene expression (log2 cpm). (C) Heatmap of transcription factor expression in Siglec-F+ IL5Rα− cells and GMPs. Factors are grouped according to significance (FDR < 0.05, and not-significant n.s FDR > 0.05). The heatmap is color-coded by the average log2 counts per million
